
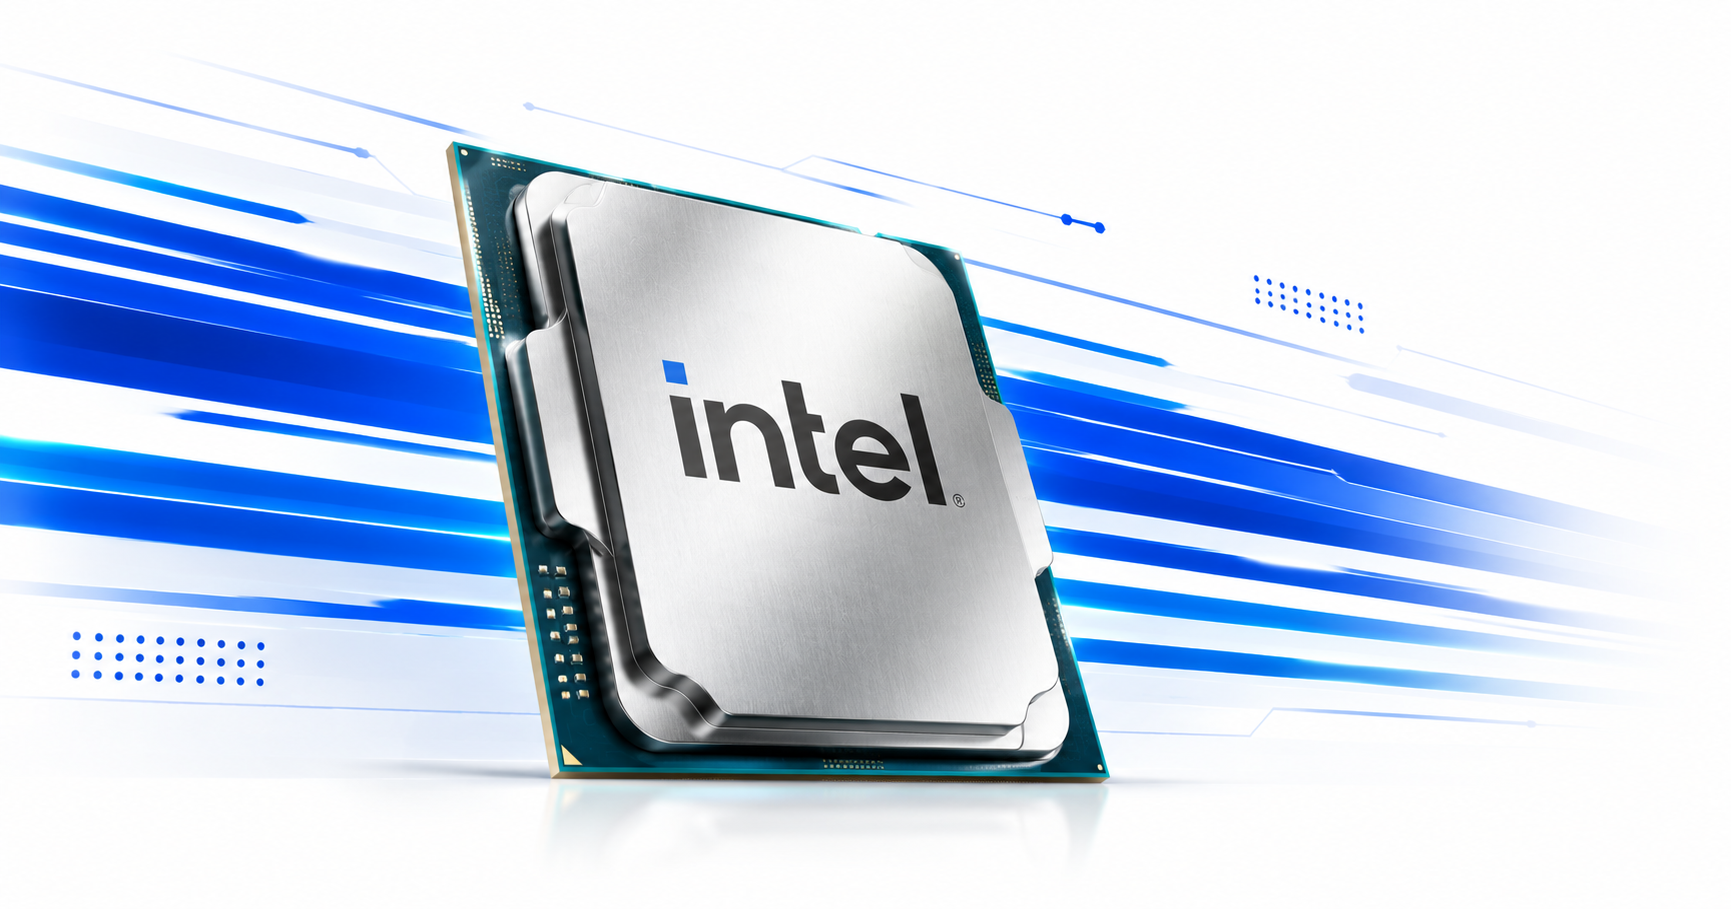

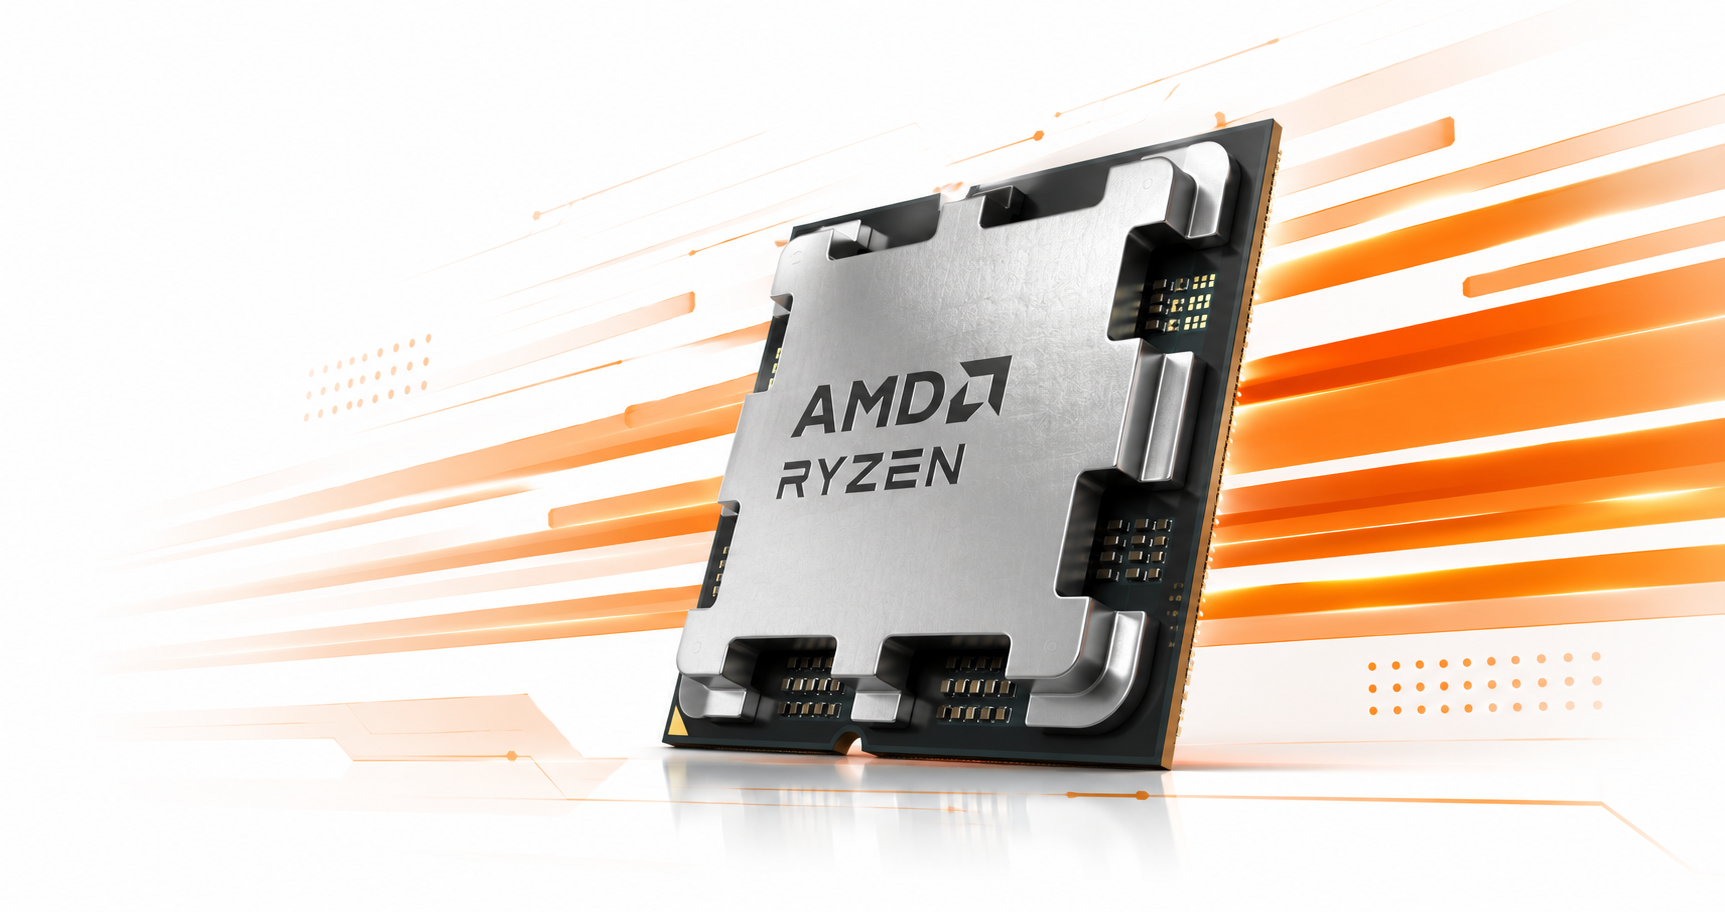
Intel Core Ultra 9 285TVSAMD Ryzen 5 8400F
Performance, specifications and real-world gaming comparison
♜ WINNERIntel Core Ultra 9 285T+1%Lepsza wydajność ogólna
Intel
Core Ultra 9 285T
VSZWYCIĘZCACore Ultra 9 285T0%Lepsza wydajność ogólna
AMD
Ryzen 5 8400F
Wydajność5749
Efektywność6494
Wiarygodność danych3838
Model H2H o stałej skali. Brakujące metryki są pomijane, a nie szacowane z wyniku ogólnego.
Intel Core Ultra 9 285T vs AMD Ryzen 5 8400F: kluczowy wniosek
Porównanie Core Ultra 9 285T i Ryzen 5 8400F pokazuje przewagę 16% dla Core Ultra 9 285T w «wydajność w grach», ale Ryzen 5 8400F może być lepszy w «efektywność i funkcje». Niżej sprawdzisz, czy różnica wynika z FPS, specyfikacji, efektywności, ceny czy platformy.
PROFIL PODSUMOWANIA
Radar zweryfikowanych metryk
Osie bez danych są ukryte; każda wartość używa stałej skali.
IntelAMDWydajność
Jeden rdzeń
Cache L3
Efektywność
5749
9078
10
6494
WYNIK PORÓWNANIA
Urządzenia mają taki sam wynik ogólny
Core Ultra 9 285T prowadzi w wydajności ogólnej, a Core Ultra 9 285T oferuje lepszą opłacalność. Sprawdź swoje aplikacje przed wyborem.
Wydajność jest prawie identyczna
Core Ultra 9 285T kosztuje mniej
OCENA OGÓLNA
Przegląd
Scores are calculated from specifications, performance, and efficiency.
Sekcja «Wynik podsumowania» porównuje Core Ultra 9 285T i Ryzen 5 8400F na podstawie znormalizowanych danych H2H i zamienia specyfikacje, testy oraz opłacalność w praktyczny kontekst wyboru.
GryWydajność DirectX, OpenCL i Vulkan
57Lepsze
49
Aplikacje profesjonalneModelowanie 3D, montaż wideo i rendering
47Lepsze
42
AI i machine learningMożliwości machine learning i AI
45Lepsze
39
Efektywność energetycznaPobór mocy w różnych obciążeniach
64
94Lepsze
Ocena Head to HeadOgólna ocena katalogu
59
59
PEŁNE PORÓWNANIE
Specyfikacja
The better numeric value is highlighted in green, taking the metric direction into account.
Sekcja «Specyfikacja» porównuje Core Ultra 9 285T i Ryzen 5 8400F na podstawie znormalizowanych danych H2H i zamienia specyfikacje, testy oraz opłacalność w praktyczny kontekst wyboru.
Data premiery20242024
Cache L1——
Cache L2——
Device classDesktopDesktop
PassMark39873Lepsze23428
PBP / MTP35 / 112 W65 WLepsze
Cores / Threads8P+16E / 24Lepsze6 / 12
SocketLGA1851LepszeAM5
TaktowanieP 1,4 - 5,4 GHz / E 1,2 - 4,6 GHz4,2 - 4,7 GHzLepsze
Taktowanie bazowe1400 MHz4200 MHzLepsze
Taktowanie boost5400 MHzLepsze4700 MHz
Cache L336 MBLepsze16 MB
Zintegrowana grafikaArc Xe2 64 2 GHz—
ArchitekturaArrow LakePhoenix
Pobór mocy35 / 112 WLepsze65 W
Proces technologiczny3 nmLepsze4 nm
Obsługa pamięciDDR5-6400DDR5-5200
HEAD TO HEAD · INDEKS OBLICZONY
Indeksy obciążeń H2H
Porównywalne indeksy wewnętrzne w stałej skali 0–100.
Sekcja «Benchmarki» porównuje Core Ultra 9 285T i Ryzen 5 8400F na podstawie znormalizowanych danych H2H i zamienia specyfikacje, testy oraz opłacalność w praktyczny kontekst wyboru.
H2H Single-core IndexH2H Index / 100907814%
H2H Multi-core IndexH2H Index / 100000%
H2H Productivity IndexH2H Index / 100605214%
H2H Rendering IndexH2H Index / 10010100%
H2H Value IndexH2H Index / 100000%
Wersjonowane indeksy H2H z normalizowanych danych katalogu; nie są wynikami zewnętrznych benchmarków.
HEAD TO HEAD · INDEKS OBLICZONY
Indeksy obciążeń AI H2H
Profile szacowane na podstawie dostępnej wydajności i pamięci.
Sekcja «Szczegółowe porównanie» porównuje Core Ultra 9 285T i Ryzen 5 8400F na podstawie znormalizowanych danych H2H i zamienia specyfikacje, testy oraz opłacalność w praktyczny kontekst wyboru.
H2H ML Preprocessing IndexH2H Index / 100403416%
H2H CPU Inference IndexH2H Index / 100453817%
H2H Local LLM CPU IndexH2H Index / 100332913%
H2H Data Pipeline IndexH2H Index / 100463916%
H2H Computer Vision CPU IndexH2H Index / 100433715%
Wersjonowane indeksy H2H z normalizowanych danych katalogu; nie są wynikami zewnętrznych benchmarków.
WYJAŚNIENIE AI · HEAD TO HEAD
Wyjaśnij to porównanie
Nie tylko procenty: przyczyny, istotne specyfikacje i praktyczny wpływ każdego wykresu.
Co wyjaśni AI
Wynik ogólny, radar, FPS, testy syntetyczne, specyfikacje, efektywność i opłacalność.
PRAWDZIWE KONFIGURACJE
Doświadczenia właścicieli
Prawdziwe zestawy, wyniki i opinie społeczności.
♢Sprawdzone przez moderatora☆Pomocne dla społeczności🏅Odznaki eksperta
Najczęstsze pytania o porównanie
Short recommendations based on performance, memory, power consumption, and intended use.
01Which is better for gaming: Core Ultra 9 285T or Ryzen 5 8400F?+
Core Ultra 9 285T has the higher overall gaming score, while Core Ultra 9 285T offers the better price-to-performance ratio. The final choice depends on resolution and settings.
02Which is better for streaming?+
Core Ultra 9 285T is the stronger streaming choice thanks to performance, hardware encoding, and application support. Check AV1, H.264, and HEVC support before buying.
03Which is better for Blender?+
Core Ultra 9 285T is generally the better option for Blender and GPU rendering. Rendering-engine support and available VRAM also matter.
04Which is better for video editing?+
Core Ultra 9 285T offers more overall performance, while Core Ultra 9 285T offers more memory headroom. Codecs, hardware encoders, and editor optimization can change the result.
05Which is better for neural networks and AI?+
Core Ultra 9 285T is the more practical option for local AI workloads. VRAM capacity, compute libraries, and framework compatibility are especially important.
06Which is better for 1080p?+
Core Ultra 9 285T is the most rational 1080p choice, where high frame rates and cost per frame matter most.
07Which is better for 1440p?+
Core Ultra 9 285T leads in combined 1440p performance. Core Ultra 9 285T can be preferable for heavy textures and games with high VRAM usage.
08Which is better for 4K?+
Core Ultra 9 285T is preferable for 4K, where total performance, memory bandwidth, and VRAM capacity have the greatest impact.
09Which is better for a quiet PC?+
Core Ultra 9 285T is easier to use in a quiet build because of its lower estimated power and thermal load. Actual noise depends on the specific cooler.
10Which is better without replacing the power supply?+
Core Ultra 9 285T is the safer candidate because its stated power consumption is lower. Verify PSU wattage, age, and power connectors.
11Is it worth upgrading from the previous generation?+
Consider upgrading to Core Ultra 9 285T if your current device no longer delivers the required FPS, memory capacity, or feature support. A gain below 15–20% is usually worth waiting for a price cut.