
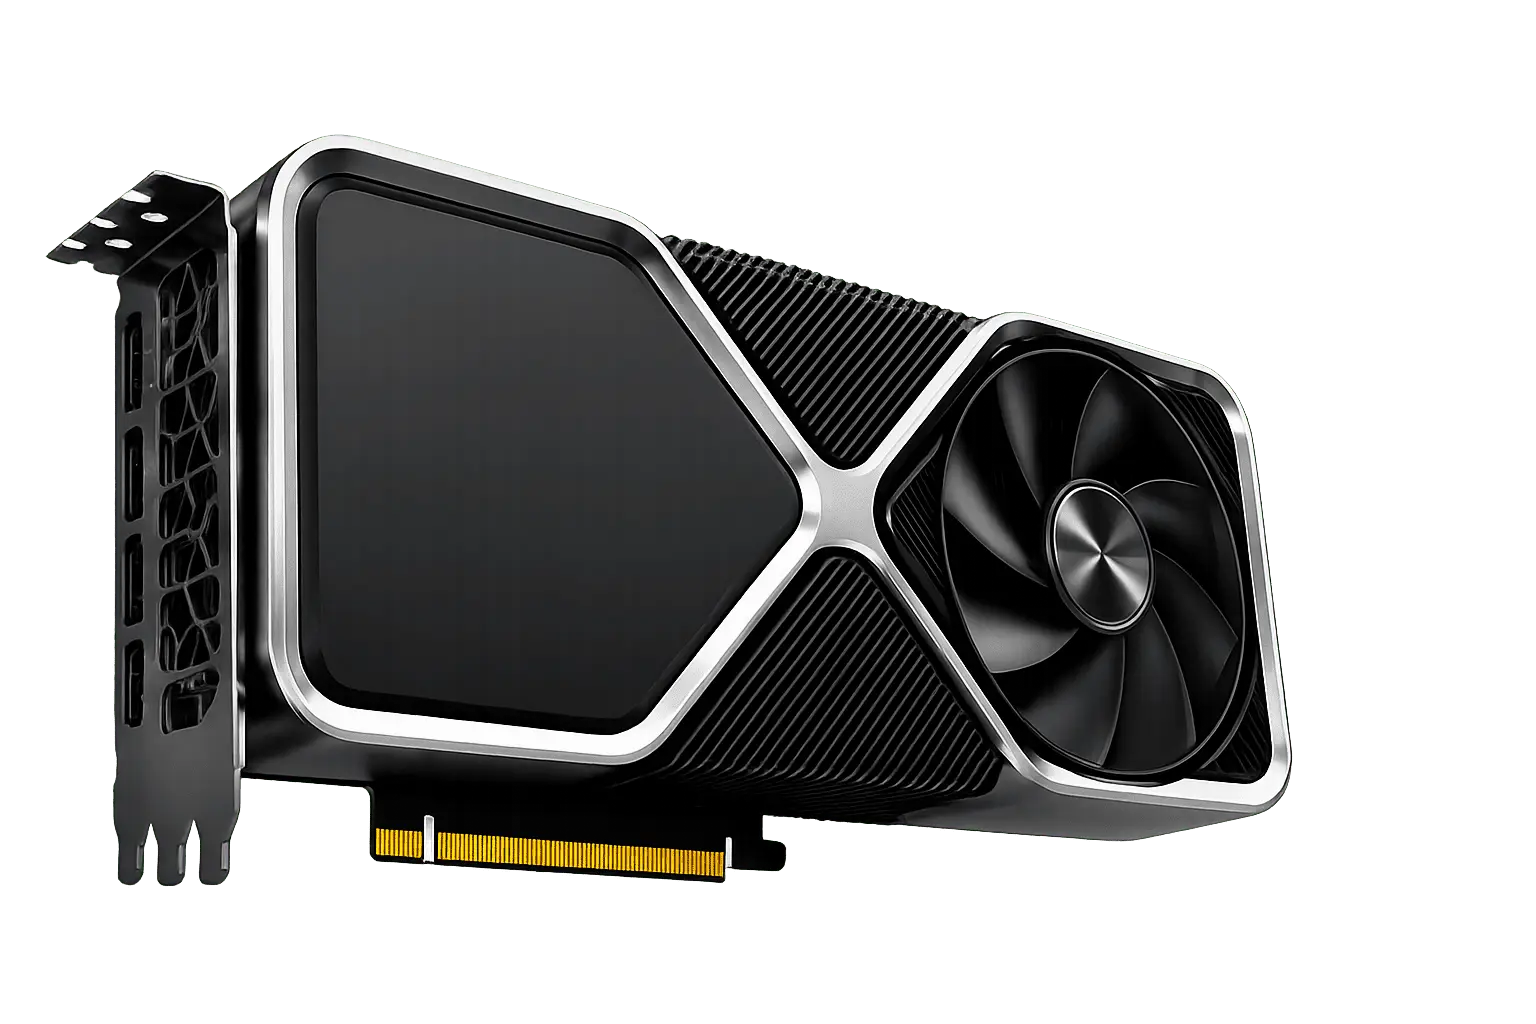

GeForce RTX 5090VSGeForce RTX 4090
Performance, specifications and real-world gaming comparison
♜ WINNERGeForce RTX 5090+14%ประสิทธิภาพเกมดีกว่า
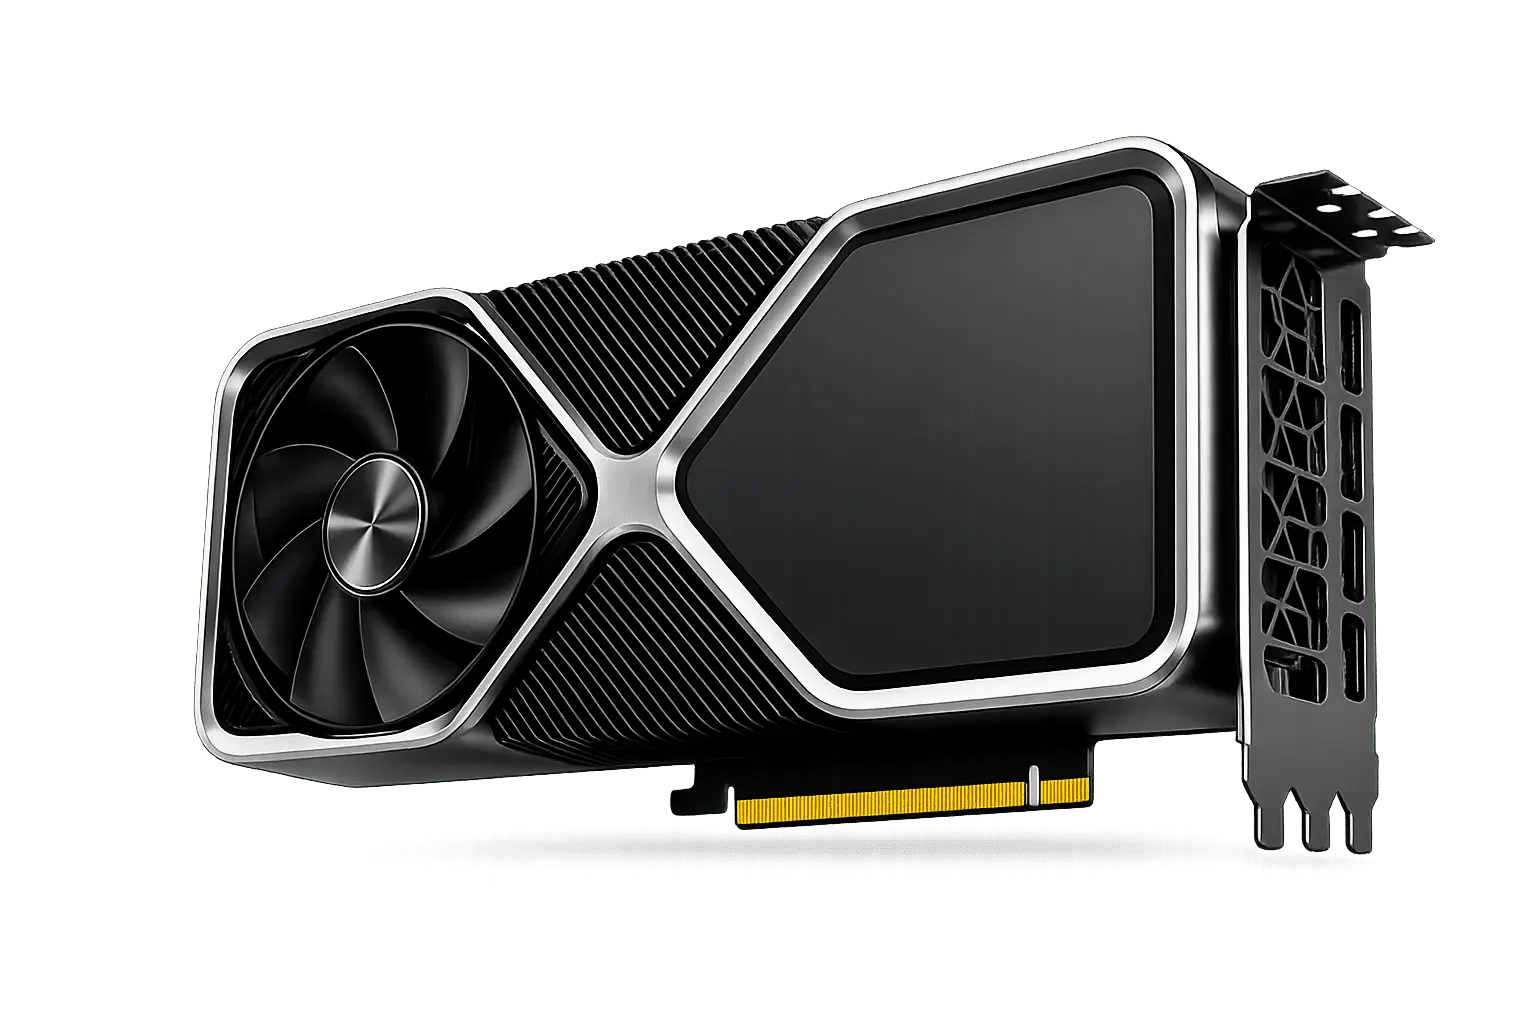
NVIDIA
RTX 5090
VSผู้ชนะRTX 509013%ประสิทธิภาพเกมดีกว่า
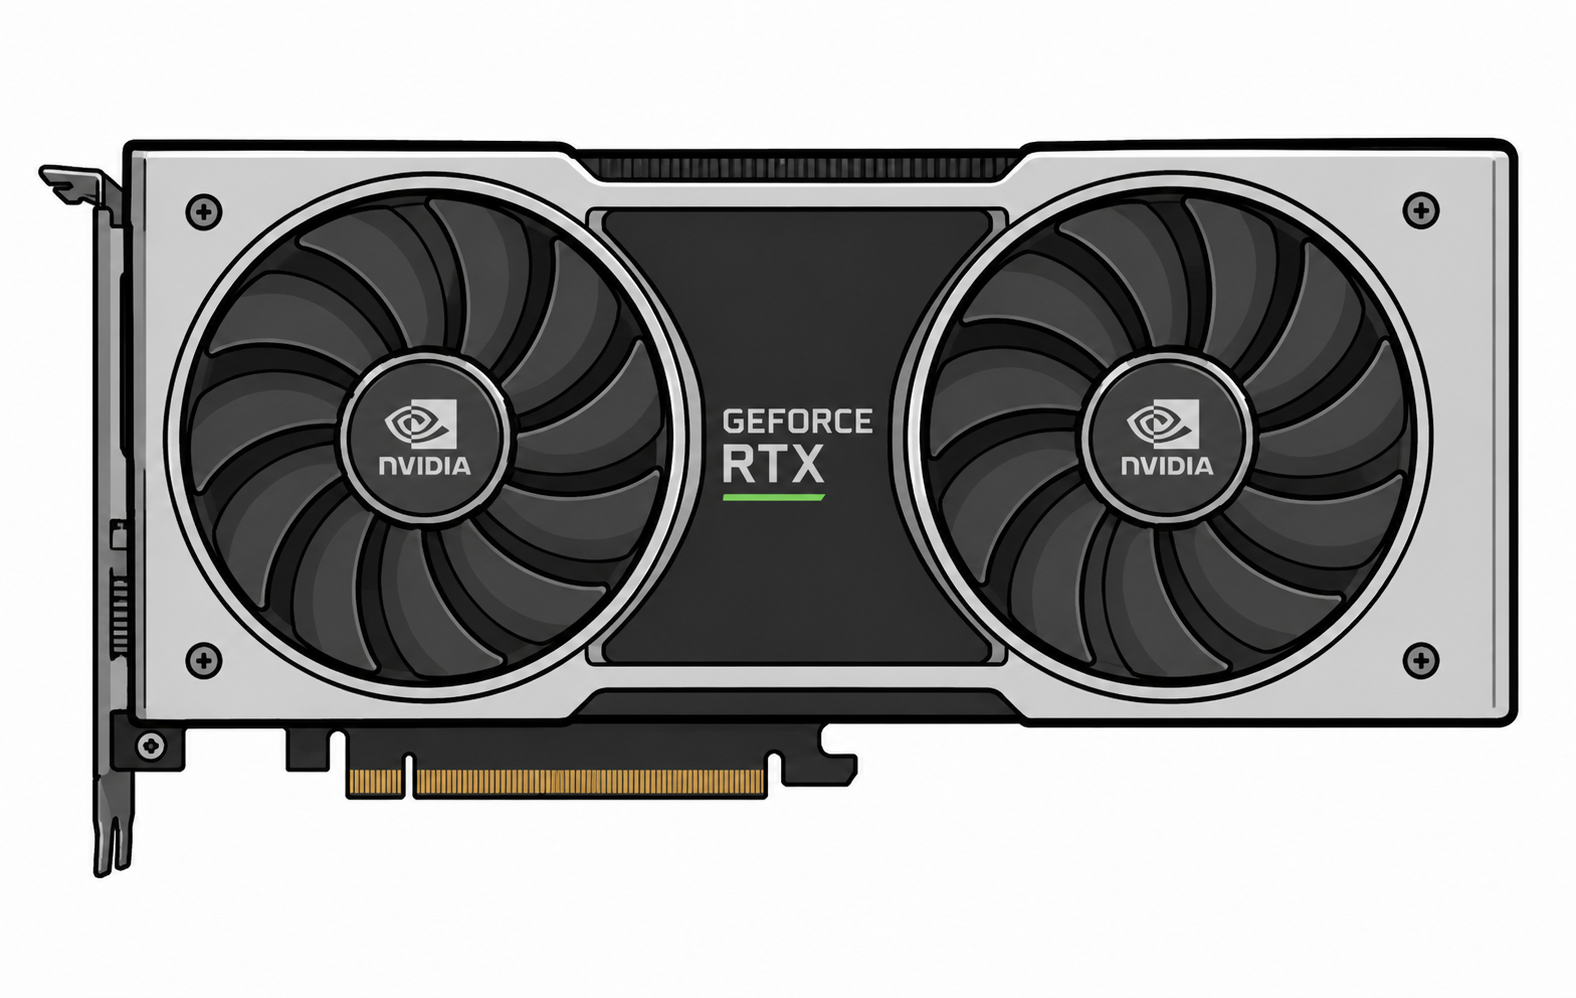
NVIDIA
RTX 4090
ประสิทธิภาพ10088
ประสิทธิภาพต่อพลังงาน5865
ราคา / ประสิทธิภาพ5071
ความน่าเชื่อถือของข้อมูล6969
โมเดล H2H แบบสเกลคงที่ เมตริกที่ไม่มีข้อมูลจะถูกละไว้ ไม่ประเมินจากคะแนนรวม
GeForce RTX 5090 vs GeForce RTX 4090: ข้อสรุปหลัก
การเปรียบเทียบ RTX 5090 และ RTX 4090 แสดงว่า RTX 5090 นำ 14% ใน «ประสิทธิภาพเกม» แต่ RTX 4090 อาจดีกว่าใน «ความคุ้มค่า» ดูด้านล่างเพื่อแยกว่าความต่างมาจาก FPS, สเปก, ประสิทธิภาพ, ราคา หรือแพลตฟอร์ม
โปรไฟล์สรุป
เรดาร์เมตริกที่ยืนยันแล้ว
แกนที่ไม่มีข้อมูลจะถูกซ่อน และทุกค่าจะใช้สเกลคงที่
 NVIDIANVIDIA
ประสิทธิภาพ
ประสิทธิภาพต่อพลังงาน
ราคา / ประสิทธิภาพ
ความจุหน่วยความจำ
10088
5865
5071
100100
ผลการเปรียบเทียบ
RTX 5090 เป็นตัวเลือกโดยรวมที่ดีที่สุด
RTX 5090 นำด้านประสิทธิภาพเกมรวม ส่วน RTX 4090 ให้ราคาต่อเฟรมดีกว่า การเลือกสุดท้ายขึ้นกับฟีเจอร์ หน่วยความจำ และเกมที่ใช้
RTX 5090 นำในดัชนีประสิทธิภาพรวม
RTX 4090 ราคาถูกกว่า
ตำแหน่งในแคตตาล็อก
อันดับทั้งหมด →อันดับการ์ดจอ
อันดับ 1–6จาก 61
ข้อสรุปการเปรียบเทียบ
ควรเลือกตัวไหน?
สองข้อสรุปเชิงปฏิบัติจากคะแนนชุมชนและความคุ้มค่าในการเล่นเกม
GeForce RTX 5090
0 ถูกใจผู้ใช้ Head to Head เลือกรุ่นนี้บ่อยกว่าในตอนนี้
GeForce RTX 4090
71/100 · ราคา $1599การเลือกอิงจากดัชนีราคา/ประสิทธิภาพและราคาเปิดตัว
คะแนนรวม
ภาพรวม
Scores are calculated from specifications, performance, and efficiency.
ส่วน «คะแนนสรุป» เปรียบเทียบ RTX 5090 และ RTX 4090 ด้วยข้อมูล H2H ที่ปรับมาตรฐาน และแปลงสเปก การทดสอบ และความคุ้มค่าเป็นบริบทการซื้อที่ใช้ได้จริง
เกมประสิทธิภาพ DirectX, OpenCL และ Vulkan
100ดีกว่า
88
แอปมืออาชีพโมเดล 3D, ตัดต่อวิดีโอ และเรนเดอร์
78ดีกว่า
70
AI และ machine learningความสามารถ machine learning และ AI
76ดีกว่า
67
ประสิทธิภาพพลังงานการใช้พลังงานในโหลดต่าง ๆ
58
65ดีกว่า
คะแนน Head to Headคะแนนรวมของแคตตาล็อก
82ดีกว่า
80
การเปรียบเทียบฉบับเต็ม
ข้อมูลจำเพาะ
The better numeric value is highlighted in green, taking the metric direction into account.
ส่วน «สเปก» เปรียบเทียบ RTX 5090 และ RTX 4090 ด้วยข้อมูล H2H ที่ปรับมาตรฐาน และแปลงสเปก การทดสอบ และความคุ้มค่าเป็นบริบทการซื้อที่ใช้ได้จริง
Device classDesktopDesktop
DirectX12.212.2
Vulkan1.41.4
OpenGL4.64.6
UpscalingDLSS 4DLSS 3
Compute APIOpenCL 3.0, CUDA 12.0OpenCL 3.0, CUDA 8.9
HDMI1x HDMI 2.1b1x HDMI 2.1
DisplayPortDisplayPort 2.1b3x DisplayPort 1.4a
วันที่เปิดตัว20252022
ราคาเปิดตัว—$1599
สถาปัตยกรรมBlackwell 2.0Ada Lovelace
PSU ที่แนะนำ950 W850 Wดีกว่า
ความยาว304 mm304 mm
ความหนาDual-slotTriple-slot
จำนวนจอสูงสุด44
ความละเอียดสูงสุด7680 × 43207680 × 4320
จำนวนทรานซิสเตอร์92.2 billionดีกว่า76300 million
ขนาด die750 mm²609 mm²ดีกว่า
หน่วย shader / คอร์21760ดีกว่า16384
TFLOPS104.8ดีกว่า82.58
การใช้พลังงาน575 W450 Wดีกว่า
ชนิดหน่วยความจำGDDR7GDDR6X
ขั้วต่อไฟ16 pin16 pin
ความเร็วพื้นฐาน2017 MHz2235 MHzดีกว่า
ความเร็วสัญญาณนาฬิกา2017 - 2407 MHz2235 - 2520 MHzดีกว่า
ความเร็ว Boost2407 MHz2520 MHzดีกว่า
หน่วยความจำวิดีโอ32 GB GDDR7ดีกว่า24 GB GDDR6X
ความถี่หน่วยความจำ28 GHzดีกว่า21 GHz
บัสหน่วยความจำ512 bitดีกว่า384 bit
แบนด์วิดท์หน่วยความจำ1792 GB/sดีกว่า1008 GB/s
อินเทอร์เฟซPCIe 5x16PCIe 4x16
การใช้พลังงาน575 W450 Wดีกว่า
กระบวนการผลิต4 nmดีกว่า5 nm
USB Type-Cไม่ไม่
แคชหน่วยความจำ96 MB L2ดีกว่าL1 128 KB, L2 72 MB
GAME TEST BENCH
FPS ในเกม
Available results are shown separately; missing data is not treated as zero.
ส่วน FPS เกมเปรียบเทียบ RTX 5090 และ RTX 4090 ด้วย preset ที่คัดจาก H2H Lab สัญญาณสำคัญไม่ได้มีแค่ FPS เฉลี่ย แต่รวมถึงพฤติกรรมที่ 1440p และ 4K ผลของขนาดหน่วยความจำและความกว้างบัสต่อ texture หนัก ความนิ่งของ 1% low และว่าเอนจินเกมเอนเอียงไปทาง raster, ray tracing หรือความพร้อมของไดรเวอร์
RTX 5090RTX 4090
Verified H2HCommunity VerifiedEstimatedPredicted

Black Myth: Wukong
1080p High
51 FPSEstimated 66%
45 FPSEstimated 66%
1080p Ultra
44 FPSEstimated 66%
38 FPSEstimated 66%
1440p Ultra
33 FPSEstimated 66%
29 FPSEstimated 66%
4K Ultra
19 FPSEstimated 66%
17 FPSEstimated 66%
Black Myth: Wukong51Estimated 66%45Estimated 66%44Estimated 66%38Estimated 66%33Estimated 66%29Estimated 66%19Estimated 66%17Estimated 66%
Call of Duty: Warzone51Estimated 66%45Estimated 66%44Estimated 66%38Estimated 66%33Estimated 66%29Estimated 66%19Estimated 66%17Estimated 66%
Counter-Strike 2416Estimated 74%365Estimated 74%288Estimated 74%252Estimated 74%215Estimated 74%188Estimated 74%109Estimated 74%95Estimated 74%
Cyberpunk 2077262Estimated 74%230Estimated 74%234Estimated 74%205Estimated 74%162Estimated 74%142Estimated 74%78Estimated 74%68Estimated 74%
Forza Horizon 5324Estimated 80%284Estimated 80%221Estimated 74%194Estimated 74%196Estimated 74%172Estimated 74%150Estimated 74%131Estimated 74%
God of War Ragnarök51Estimated 66%45Estimated 66%44Estimated 66%38Estimated 66%33Estimated 66%29Estimated 66%19Estimated 66%17Estimated 66%
Hogwarts Legacy214Estimated 74%187Estimated 74%179Estimated 74%157Estimated 74%143Estimated 74%126Estimated 74%84Estimated 74%74Estimated 74%
Microsoft Flight Simulator 202451Estimated 66%45Estimated 66%44Estimated 66%38Estimated 66%33Estimated 66%29Estimated 66%19Estimated 66%17Estimated 66%
Monster Hunter Wilds51Estimated 66%45Estimated 66%44Estimated 66%38Estimated 66%33Estimated 66%29Estimated 66%19Estimated 66%17Estimated 66%
Starfield51Estimated 66%45Estimated 66%44Estimated 66%38Estimated 66%33Estimated 66%29Estimated 66%19Estimated 66%17Estimated 66%
HEAD TO HEAD · ดัชนีคำนวณ
ดัชนี workload H2H
ดัชนีภายในที่เทียบกันได้บนสเกลคงที่ 0–100
ส่วน «Benchmark» เปรียบเทียบ RTX 5090 และ RTX 4090 ด้วยข้อมูล H2H ที่ปรับมาตรฐาน และแปลงสเปก การทดสอบ และความคุ้มค่าเป็นบริบทการซื้อที่ใช้ได้จริง
H2H Raster IndexH2H Index / 1001008813%
H2H Compute IndexH2H Index / 10097899%
H2H Rendering IndexH2H Index / 100100919%
H2H Memory Workload IndexH2H Index / 1001001000%
H2H Efficiency IndexH2H Index / 100586511%
ดัชนี H2H จากข้อมูลแคตตาล็อกที่ปรับมาตรฐาน ไม่ใช่ผล benchmark ภายนอก
HEAD TO HEAD · ดัชนีคำนวณ
ดัชนี workload AI H2H
โปรไฟล์ประมาณจากข้อมูลประสิทธิภาพและหน่วยความจำที่มี
ส่วน «การเปรียบเทียบละเอียด» เปรียบเทียบ RTX 5090 และ RTX 4090 ด้วยข้อมูล H2H ที่ปรับมาตรฐาน และแปลงสเปก การทดสอบ และความคุ้มค่าเป็นบริบทการซื้อที่ใช้ได้จริง
H2H Image Generation IndexH2H Index / 100100937%
H2H ML Training IndexH2H Index / 100100937%
H2H Inference IndexH2H Index / 100100919%
H2H Local LLM IndexH2H Index / 100100955%
H2H Computer Vision IndexH2H Index / 100100928%
ดัชนี H2H จากข้อมูลแคตตาล็อกที่ปรับมาตรฐาน ไม่ใช่ผล benchmark ภายนอก
API กราฟิก, SDK และ upscaling
ส่วน «กราฟิก API, SDK และ upscaling» เปรียบเทียบ RTX 5090 และ RTX 4090 ด้วยข้อมูล H2H ที่ปรับมาตรฐาน และแปลงสเปก การทดสอบ และความคุ้มค่าเป็นบริบทการซื้อที่ใช้ได้จริง
DirectX12.212.2
Vulkan1.41.4
OpenGL4.64.6
UpscalingDLSS 4DLSS 3
Compute APIOpenCL 3.0, CUDA 12.0OpenCL 3.0, CUDA 8.9
สถาปัตยกรรมและวันเปิดตัว
ส่วน «สถาปัตยกรรมและวันเปิดตัว» เปรียบเทียบ RTX 5090 และ RTX 4090 ด้วยข้อมูล H2H ที่ปรับมาตรฐาน และแปลงสเปก การทดสอบ และความคุ้มค่าเป็นบริบทการซื้อที่ใช้ได้จริง
สถาปัตยกรรมBlackwell 2.0Ada Lovelace
กระบวนการผลิต4 nmดีกว่า5 nm
วันที่เปิดตัว20252022
Device classDesktopDesktop
คอร์ GPU, die และความเร็ว
ส่วน «คอร์และความเร็ว» เปรียบเทียบ RTX 5090 และ RTX 4090 ด้วยข้อมูล H2H ที่ปรับมาตรฐาน และแปลงสเปก การทดสอบ และความคุ้มค่าเป็นบริบทการซื้อที่ใช้ได้จริง
จำนวนทรานซิสเตอร์92.2 billionดีกว่า76300 million
ขนาด die750 mm²609 mm²ดีกว่า
หน่วย shader / คอร์21760ดีกว่า16384
ความเร็วพื้นฐาน2017 MHz2235 MHzดีกว่า
ความเร็ว Boost2407 MHz2520 MHzดีกว่า
ขนาดบอร์ด พลังงาน และความเข้ากันได้
ส่วน «ฟอร์มแฟกเตอร์และความเข้ากันได้» เปรียบเทียบ RTX 5090 และ RTX 4090 ด้วยข้อมูล H2H ที่ปรับมาตรฐาน และแปลงสเปก การทดสอบ และความคุ้มค่าเป็นบริบทการซื้อที่ใช้ได้จริง
อินเทอร์เฟซPCIe 5x16PCIe 4x16
ความยาว304 mm304 mm
ความหนาDual-slotTriple-slot
PSU ที่แนะนำ950 W850 Wดีกว่า
ขั้วต่อไฟ16 pin16 pin
พอร์ตแสดงผลและข้อจำกัด
ส่วน «พอร์ตแสดงผล» เปรียบเทียบ RTX 5090 และ RTX 4090 ด้วยข้อมูล H2H ที่ปรับมาตรฐาน และแปลงสเปก การทดสอบ และความคุ้มค่าเป็นบริบทการซื้อที่ใช้ได้จริง
HDMI1x HDMI 2.1b1x HDMI 2.1
DisplayPortDisplayPort 2.1b3x DisplayPort 1.4a
USB Type-Cไม่ไม่
จำนวนจอสูงสุด44
ความละเอียดสูงสุด7680 × 43207680 × 4320
หน่วยความจำและ throughput การคำนวณ
ส่วน «VRAM และแบนด์วิดท์» เปรียบเทียบ RTX 5090 และ RTX 4090 ด้วยข้อมูล H2H ที่ปรับมาตรฐาน และแปลงสเปก การทดสอบ และความคุ้มค่าเป็นบริบทการซื้อที่ใช้ได้จริง
หน่วยความจำวิดีโอ32 GB GDDR7ดีกว่า24 GB GDDR6X
ชนิดหน่วยความจำGDDR7GDDR6X
บัสหน่วยความจำ512 bitดีกว่า384 bit
TFLOPS104.8ดีกว่า82.58
HEAD TO HEAD · ค้นพบ
6การเปรียบเทียบอื่น
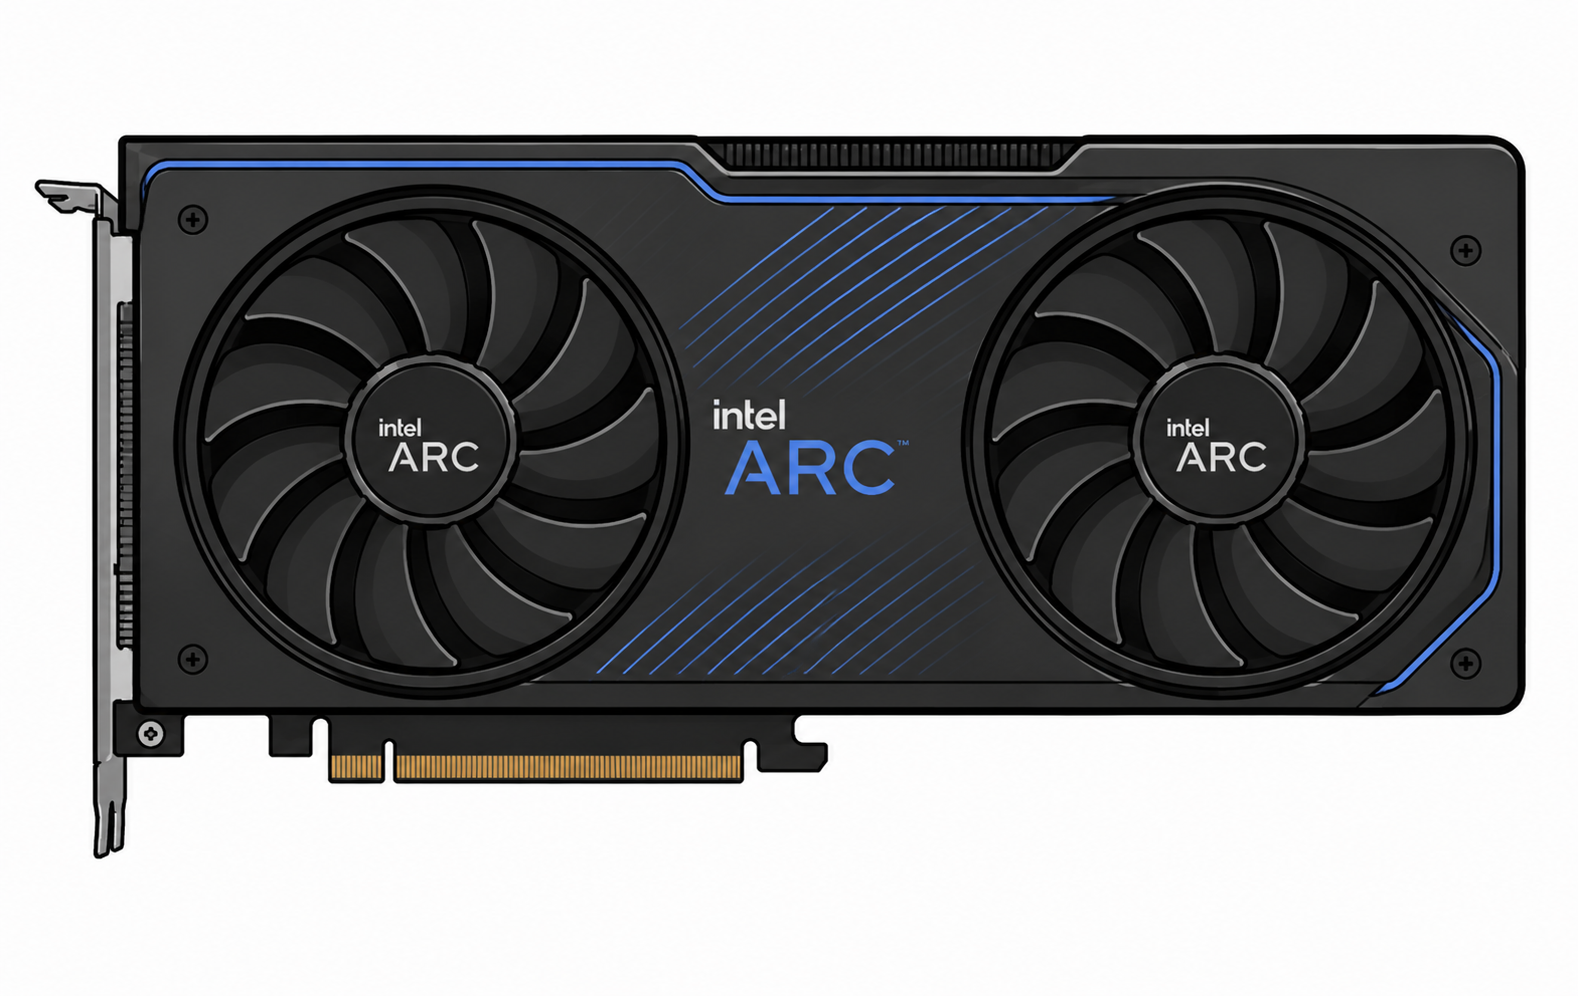 Arc A310Intel
 Navi II 2CU 7xxx/9xxxAMD
Reviews and questions
AI อธิบาย · HEAD TO HEAD
อธิบายการเปรียบเทียบนี้
มากกว่าเปอร์เซ็นต์: สาเหตุ สเปกที่เกี่ยวข้อง และผลกระทบจริงหลังกราฟแต่ละอัน
AI จะอธิบายอะไร
คะแนนรวม เรดาร์ FPS การทดสอบสังเคราะห์ สเปก ประสิทธิภาพ และความคุ้มค่า
สเปกจริง
ประสบการณ์จากเจ้าของ
สเปกจริง ผลลัพธ์ และความคิดเห็นจากชุมชน
♢ผ่านการตรวจโดยผู้ดูแล☆เป็นประโยชน์ต่อชุมชน🏅เหรียญผู้เชี่ยวชาญ
คำถามที่พบบ่อยเกี่ยวกับการเปรียบเทียบ
Short recommendations based on performance, memory, power consumption, and intended use.
01Which is better for gaming: RTX 5090 or RTX 4090?+
RTX 5090 has the higher overall gaming score, while RTX 4090 offers the better price-to-performance ratio. The final choice depends on resolution and settings.
02Which is better for streaming?+
RTX 5090 is the stronger streaming choice thanks to performance, hardware encoding, and application support. Check AV1, H.264, and HEVC support before buying.
03Which is better for Blender?+
RTX 5090 is generally the better option for Blender and GPU rendering. Rendering-engine support and available VRAM also matter.
04Which is better for video editing?+
RTX 5090 offers more overall performance, while RTX 5090 offers more memory headroom. Codecs, hardware encoders, and editor optimization can change the result.
05Which is better for neural networks and AI?+
RTX 5090 is the more practical option for local AI workloads. VRAM capacity, compute libraries, and framework compatibility are especially important.
06Which is better for 1080p?+
RTX 4090 is the most rational 1080p choice, where high frame rates and cost per frame matter most.
07Which is better for 1440p?+
RTX 5090 leads in combined 1440p performance. RTX 5090 can be preferable for heavy textures and games with high VRAM usage.
08Which is better for 4K?+
RTX 5090 is preferable for 4K, where total performance, memory bandwidth, and VRAM capacity have the greatest impact.
09Which is better for a quiet PC?+
RTX 4090 is easier to use in a quiet build because of its lower estimated power and thermal load. Actual noise depends on the specific cooler.
10Which is better without replacing the power supply?+
RTX 4090 is the safer candidate because its stated power consumption is lower. Verify PSU wattage, age, and power connectors.
11Is it worth upgrading from the previous generation?+
Consider upgrading to RTX 5090 if your current device no longer delivers the required FPS, memory capacity, or feature support. A gain below 15–20% is usually worth waiting for a price cut.