
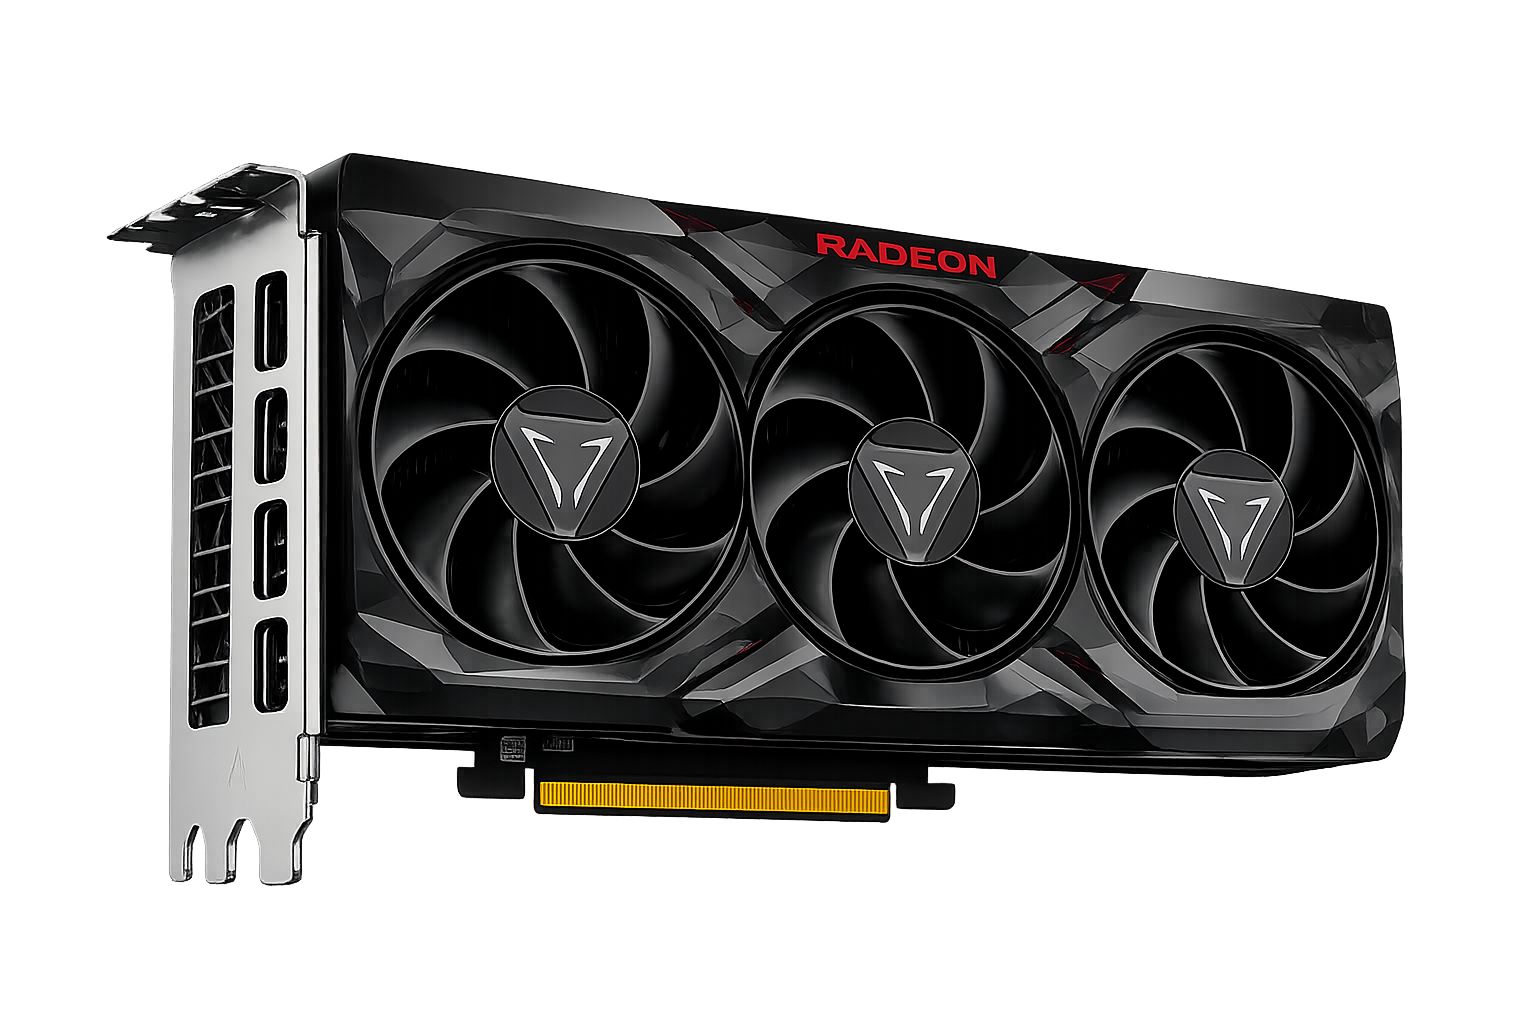

Radeon 740M 8500GVSGeForce RTX 4080 SUPER
Performance, specifications and real-world gaming comparison
♜ WINNERRadeon 740M 8500G+1%Better overall performance
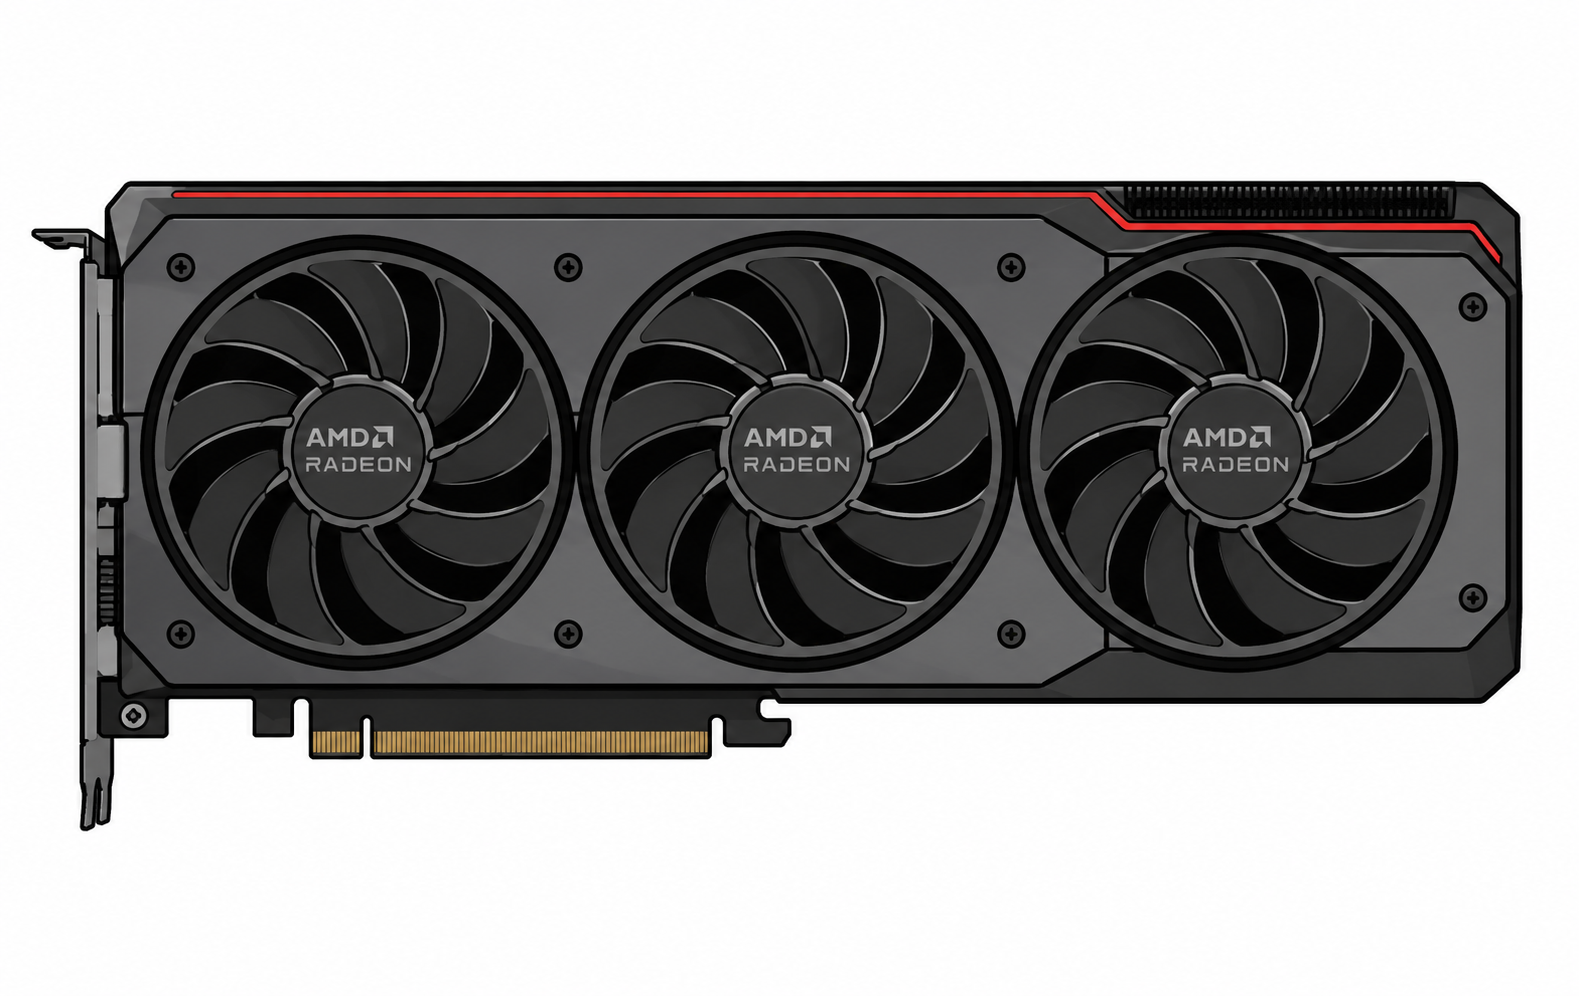
AMD
740M 8500G
VSWINNER740M 8500G1%H2H overall index
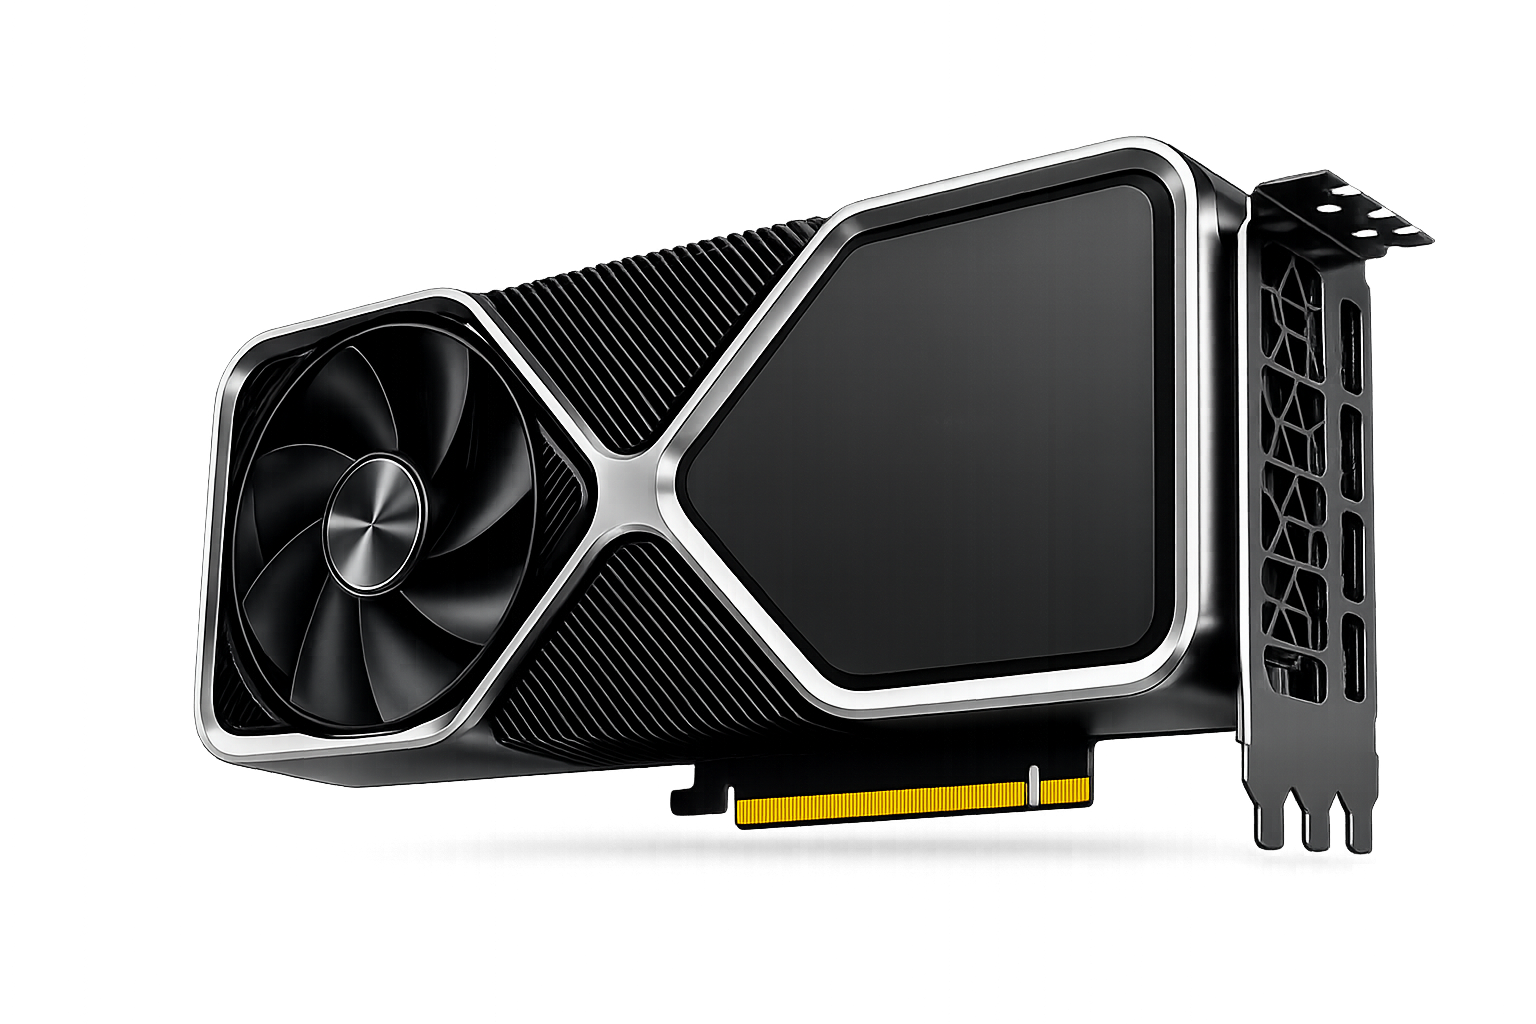
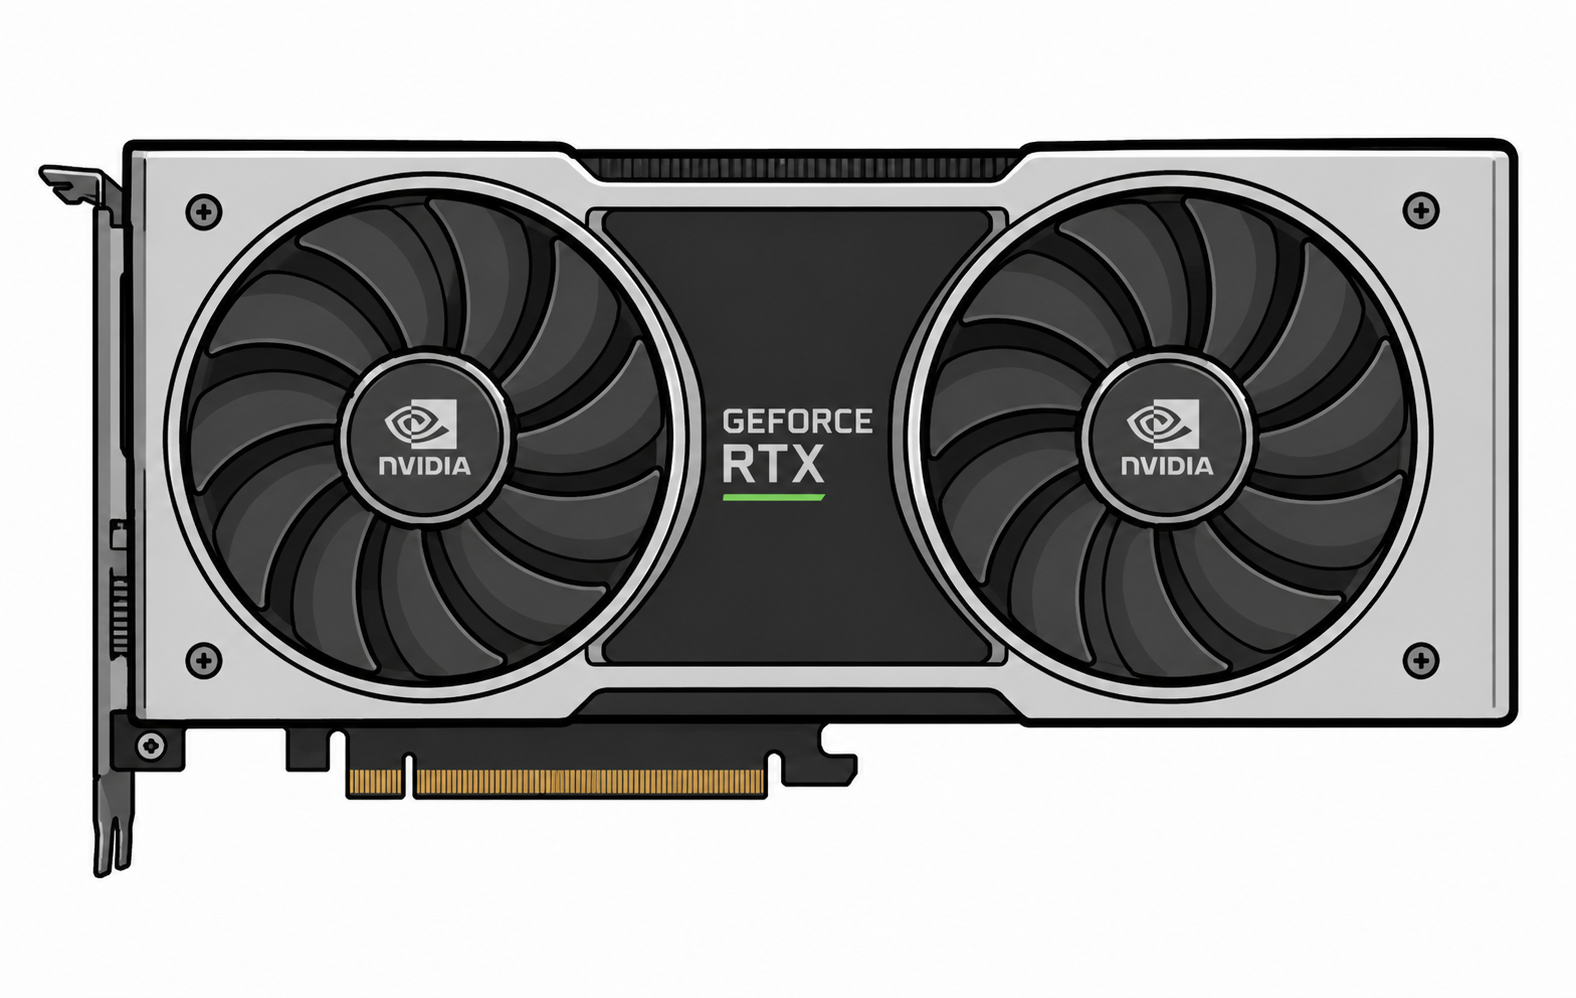
NVIDIA
RTX 4080 SUPER
Hiệu năng8085
Price / Performance10074
Data confidence30100
Fixed-scale H2H model. Missing metrics are omitted instead of estimated from the overall score.
SUMMARY PROFILE
Verified-metrics radar
Axes with missing data are hidden; every value uses a fixed scale.
AMDNVIDIAPerformance
Price / performance
8085
10074
COMMUNITY · VERIFIED DATA
Open streamer setups→Hardware used by streamers
Real public setups linked to each device.
AMD740M 8500G0No verified public setup yet
NVIDIARTX 4080 SUPER152KẾT QUẢ SO SÁNH
740M 8500G is the best overall choice
740M 8500G leads in combined gaming performance. 740M 8500G offers the better price per frame, while the final choice depends on the required features, memory, and games.
740M 8500G leads in the combined performance index
740M 8500G costs less
CATALOG POSITION
Full ranking →Graphics card ranking
Positions 1–6of 723
COMPARISON VERDICT
Which should you choose?
Two practical conclusions based on community votes and gaming value.
Radeon 740M 8500G
0 lượt thíchHead to Head visitors currently choose this model more often.
Radeon 740M 8500G
100/100 · Price $169The choice is based on the price-to-performance index and launch price.
ĐIỂM TỔNG
Tổng quan
Scores are calculated from specifications, performance, and efficiency.
GamesDirectX, OpenCL, and Vulkan performance
80
85Better
Professional applications3D modeling, video editing, and rendering
64
74Better
AI and machine learningMachine-learning and AI capabilities
62
65Better
Power efficiencyPower consumption across workloads
78
89Better
Head to Head scoreOverall catalog score
85Better
84
SO SÁNH ĐẦY ĐỦ
Thông số
The better numeric value is highlighted in green, taking the metric direction into account.
Power connector-16 pin
Power consumption-320 W
TDP-320 W
Process node4 nmBetter5 nm
Release date20232024Better
Architecture—NVIDIA Ada Lovelace
Recommended PSU——
Length——
Thickness——
HDMI——
DisplayPort——
USB Type-C——
Maximum displays——
Maximum resolution——
DirectX——
Vulkan——
OpenGL——
Upscaling——
Compute API——
TFLOPS2.8752.22Better
Launch price——
Transistor count——
Die size——
Memory cache——
Clock speed800 - 2800 MHz2295 - 2550 MHzBetter
Base clock800 MHz2295 MHzBetter
Boost clock2800 MHzBetter2550 MHz
VRAM- SMA16 GB GDDR6X
Memory typeSMAGDDR6X
VRAM capacity-16 GB
Xung nhịp bộ nhớ-23 GHz
Memory bus-256 bit
Memory bandwidth—736 GB/s
InterfaceIGPPCIe 4x16
Shader units / cores——
FPS trong game
Loading test-rig results…
HEAD TO HEAD · CALCULATED INDEX
H2H workload indices
Comparable internal indices on a fixed 0–100 scale.
H2H Raster IndexH2H Index / 10080856%
H2H Compute IndexH2H Index / 10082854%
H2H Rendering IndexH2H Index / 10080867%
H2H Memory Workload IndexH2H Index / 100088200%
H2H Efficiency IndexH2H Index / 100089200%
These are versioned H2H calculated indices derived from normalized catalog data. They are not results from 3DMark, Geekbench, Cinebench, PassMark, Blender, or another third-party benchmark.
HEAD TO HEAD · CALCULATED INDEX
H2H AI workload indices
Estimated workload profiles based on available performance and memory data.
H2H Image Generation IndexH2H Index / 10080867%
H2H ML Training IndexH2H Index / 10080867%
H2H Inference IndexH2H Index / 10080867%
H2H Local LLM IndexH2H Index / 10080878%
H2H Computer Vision IndexH2H Index / 10080867%
These are versioned H2H calculated indices derived from normalized catalog data. They are not results from 3DMark, Geekbench, Cinebench, PassMark, Blender, or another third-party benchmark.
Basic information
Architecture—NVIDIA Ada Lovelace
Process node4 nmBetter5 nm
Release date20232024Better
Launch price——
Detailed specifications
Transistor count——
Die size——
Shader units / cores——
Base clock800 MHz2295 MHzBetter
Boost clock2800 MHzBetter2550 MHz
Form factor and compatibility
InterfaceIGPPCIe 4x16
Length——
Thickness——
Recommended PSU——
Power connector-16 pin
VRAM capacity and type
VRAM- SMA16 GB GDDR6X
Memory typeSMAGDDR6X
Memory bus-256 bit
Memory bandwidth—736 GB/s
Memory cache——
Connectivity and outputs
HDMI——
DisplayPort——
USB Type-C——
Maximum displays——
Maximum resolution——
API and SDK compatibility
DirectX——
Vulkan——
OpenGL——
Upscaling——
Compute API——
HEAD TO HEAD · DISCOVER
6Other comparisons
Reviews and questions
AI EXPLAIN · HEAD TO HEAD
Explain this comparison
Beyond percentages: causes, relevant specifications, and practical impact behind every chart.
What AI will explain
Overall score, radar, FPS, synthetic tests, specifications, efficiency, and value.
REAL CONFIGURATIONS
Owner experiences
Real builds, results, and community feedback.
♢Moderator reviewed☆Helpful to the community🏅Expert badges
Câu hỏi thường gặp về so sánh
Short recommendations based on performance, memory, power consumption, and intended use.
01Which is better for gaming: 740M 8500G or RTX 4080 SUPER?+
740M 8500G has the higher overall gaming score, while 740M 8500G offers the better price-to-performance ratio. The final choice depends on resolution and settings.
02Which is better for streaming?+
RTX 4080 SUPER is the stronger streaming choice thanks to performance, hardware encoding, and application support. Check AV1, H.264, and HEVC support before buying.
03Which is better for Blender?+
RTX 4080 SUPER is generally the better option for Blender and GPU rendering. Rendering-engine support and available VRAM also matter.
04Which is better for video editing?+
740M 8500G offers more overall performance, while RTX 4080 SUPER offers more memory headroom. Codecs, hardware encoders, and editor optimization can change the result.
05Which is better for neural networks and AI?+
RTX 4080 SUPER is the more practical option for local AI workloads. VRAM capacity, compute libraries, and framework compatibility are especially important.
06Which is better for 1080p?+
740M 8500G is the most rational 1080p choice, where high frame rates and cost per frame matter most.
07Which is better for 1440p?+
740M 8500G leads in combined 1440p performance. RTX 4080 SUPER can be preferable for heavy textures and games with high VRAM usage.
08Which is better for 4K?+
740M 8500G is preferable for 4K, where total performance, memory bandwidth, and VRAM capacity have the greatest impact.
09Which is better for a quiet PC?+
RTX 4080 SUPER is easier to use in a quiet build because of its lower estimated power and thermal load. Actual noise depends on the specific cooler.
10Which is better without replacing the power supply?+
RTX 4080 SUPER is the safer candidate because its stated power consumption is lower. Verify PSU wattage, age, and power connectors.
11Is it worth upgrading from the previous generation?+
Consider upgrading to 740M 8500G if your current device no longer delivers the required FPS, memory capacity, or feature support. A gain below 15–20% is usually worth waiting for a price cut.