
NVIDIA

GeForce RTX 5070 vs Radeon RX 7900 XT
स्पेसिफिकेशन, प्रदर्शन और बेंचमार्क की पूरी तुलना
AMD
RX 7900 XT
कुल प्रदर्शन स्कोर
हमने RTX 5070 और RX 7900 XT की तुलना स्पेसिफिकेशन और संबंधित टेस्ट से की है।
↗RX 7900 XT, Head to Head कुल इंडेक्स में RTX 5070 से 18% आगे है।+18%
स्कोर Head to Head स्केल पर सामान्यीकृत हैं। ज्यादा बेहतर है।GeForce RTX 5070 vs Radeon RX 7900 XT: मुख्य निष्कर्ष
RTX 5070 और RX 7900 XT की तुलना में RX 7900 XT «गेमिंग प्रदर्शन» में 18% आगे है, जबकि RTX 5070 «दक्षता और फीचर सेट» में बेहतर हो सकता है। नीचे देखें कि अंतर FPS, स्पेसिफिकेशन, दक्षता, कीमत या प्लेटफ़ॉर्म से आता है।
सारांश प्रोफ़ाइल
सत्यापित मीट्रिक रडार
जिन अक्षों में डेटा नहीं है उन्हें छिपाया जाता है; हर मान एक निश्चित स्केल का उपयोग करता है।
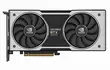 NVIDIA
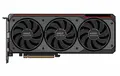 AMD
AMDप्रदर्शन
दक्षता
कीमत / प्रदर्शन
मेमोरी क्षमता
6273
8377
8186
8095
तुलना परिणाम
RX 7900 XT कुल मिलाकर बेहतर विकल्प है
RX 7900 XT संयुक्त गेम प्रदर्शन में आगे है। RX 7900 XT प्रति frame बेहतर कीमत देता है; अंतिम चुनाव features, memory और games पर निर्भर है।
RX 7900 XT संयुक्त प्रदर्शन सूचकांक में आगे है
RTX 5070 सस्ता है
कैटलॉग स्थिति
पूरी रैंकिंग →ग्राफिक्स कार्ड रैंकिंग
स्थान 23–28में से 319
तुलना निष्कर्ष
किसे चुनें?
समुदाय के वोट और गेमिंग वैल्यू पर आधारित दो व्यावहारिक निष्कर्ष।
GeForce RTX 5070
135 लाइकHead to Head विज़िटर अभी इस मॉडल को अधिक बार चुनते हैं।
GeForce RTX 5070
81/100 · कीमत $549चयन कीमत-प्रदर्शन सूचकांक और लॉन्च कीमत पर आधारित है।
समग्र स्कोर
अवलोकन
Scores are calculated from specifications, performance, and efficiency.
«सारांश स्कोर» सेक्शन सामान्यीकृत H2H डेटा से RTX 5070 और RX 7900 XT की तुलना करता है और स्पेसिफिकेशन, टेस्ट व वैल्यू संकेतों को व्यावहारिक खरीद संदर्भ में बदलता है।
गेमDirectX, OpenCL और Vulkan प्रदर्शन
62
73बेहतर
पेशेवर ऐप्स3D मॉडलिंग, वीडियो एडिटिंग और रेंडरिंग
51
59बेहतर
AI और मशीन लर्निंगमशीन लर्निंग और AI क्षमताएँ
49
57बेहतर
ऊर्जा दक्षताअलग-अलग लोड में बिजली खपत
83बेहतर
77
Head to Head स्कोरकैटलॉग का कुल स्कोर
70
76बेहतर
पूर्ण तुलना
विशेषताएँ
The better numeric value is highlighted in green, taking the metric direction into account.
«स्पेसिफिकेशन» सेक्शन सामान्यीकृत H2H डेटा से RTX 5070 और RX 7900 XT की तुलना करता है और स्पेसिफिकेशन, टेस्ट व वैल्यू संकेतों को व्यावहारिक खरीद संदर्भ में बदलता है।
DisplayPortDisplayPort 2.1bDisplayPort 2.1
HDMIHDMI 2.1bHDMI 2.1a
Device classDesktopDesktop
DirectX12.212.2
Vulkan1.41.4
OpenGL4.64.6
TFLOPS30.8751.48बेहतर
बिजली खपत250 Wबेहतर315 W
बेस क्लॉक2325 MHzबेहतर1500 MHz
मेमोरी प्रकारGDDR7GDDR6
पावर कनेक्टर16 pin8+8 pin
रिलीज़ तारीख20252022
आर्किटेक्चरBlackwell 2.0RDNA 3.0बेहतर
मोटाईDual-slotDual-slot
Compute APIOpenCL 3.0, CUDA 12.0OpenCL 2.2
लॉन्च कीमत$549बेहतर$899
शेडर यूनिट / कोर6144बेहतर5376
क्लॉक स्पीड2325 - 2512 MHzबेहतर1500 - 2400 MHz
बूस्ट क्लॉक2512 MHzबेहतर2400 MHz
वीडियो मेमोरी12 GB GDDR720 GB GDDR6बेहतर
मेमोरी आवृत्ति28 GHzबेहतर20 GHz
मेमोरी बस192 bit320 bitबेहतर
मेमोरी बैंडविड्थ672 GB/s800 GB/sबेहतर
इंटरफ़ेसPCIe 5x16PCIe 4x16
बिजली खपत250 Wबेहतर315 W
प्रक्रिया नोड4 nmबेहतर5 nm
अनुशंसित PSU600 Wबेहतर700 W
लंबाई245 mmबेहतर276 mm
डाई आकार263 mm²बेहतर529 mm²
मेमोरी कैशL1 128 KB, L2 48 MBL1 250 KB, L2 6 MB
ट्रांजिस्टर संख्या31100 million57700 millionबेहतर
अपस्केलिंगDLSS 4FSR
अधिकतम मॉनिटर44
अधिकतम रिज़ॉल्यूशन7680 × 43207680 × 4320
USB Type-Cनहींहाँ
GAME TEST BENCH
गेमिंग FPS
Available results are shown separately; missing data is not treated as zero.
गेम FPS सेक्शन चयनित H2H Lab presets में RTX 5070 और RX 7900 XT की तुलना करता है। उपयोगी संकेत केवल औसत FPS नहीं है: 1440p और 4K व्यवहार, भारी textures पर memory capacity और bus width का प्रभाव, 1% low stability और game engine raster, ray tracing या driver maturity में किसे प्राथमिकता देता है, यह भी महत्वपूर्ण है।
RTX 5070RX 7900 XT
H2H सत्यापितसमुदाय सत्यापितअनुमानितपूर्वानुमानित

Black Myth: Wukong
1080p High
30 FPSअनुमानित 66%
36 FPSअनुमानित 66%
1080p Ultra
26 FPSअनुमानित 66%
31 FPSअनुमानित 66%
1440p Ultra
19 FPSअनुमानित 66%
23 FPSअनुमानित 66%
4K Ultra
11 FPSअनुमानित 66%
13 FPSअनुमानित 66%
Black Myth: WukongRTX 507030 FPSअनुमानित 66%RX 7900 XT36 FPSअनुमानित 66%RTX 507026 FPSअनुमानित 66%RX 7900 XT31 FPSअनुमानित 66%RTX 507019 FPSअनुमानित 66%RX 7900 XT23 FPSअनुमानित 66%RTX 507011 FPSअनुमानित 66%RX 7900 XT13 FPSअनुमानित 66%
Call of Duty: WarzoneRTX 507030 FPSअनुमानित 66%RX 7900 XT36 FPSअनुमानित 66%RTX 507026 FPSअनुमानित 66%RX 7900 XT31 FPSअनुमानित 66%RTX 507019 FPSअनुमानित 66%RX 7900 XT23 FPSअनुमानित 66%RTX 507011 FPSअनुमानित 66%RX 7900 XT13 FPSअनुमानित 66%
Counter-Strike 2RTX 5070255 FPSअनुमानित 74%RX 7900 XT305 FPSअनुमानित 74%RTX 5070179 FPSअनुमानित 74%RX 7900 XT214 FPSअनुमानित 74%RTX 5070139 FPSअनुमानित 74%RX 7900 XT166 FPSअनुमानित 74%RTX 507069 FPSअनुमानित 74%RX 7900 XT83 FPSअनुमानित 74%
Cyberpunk 2077RTX 5070165 FPSअनुमानित 74%RX 7900 XT197 FPSअनुमानित 74%RTX 5070142 FPSअनुमानित 74%RX 7900 XT169 FPSअनुमानित 74%RTX 5070101 FPSअनुमानित 74%RX 7900 XT121 FPSअनुमानित 74%RTX 507046 FPSअनुमानित 74%RX 7900 XT55 FPSअनुमानित 74%
Forza Horizon 5RTX 5070208 FPSअनुमानित 80%RX 7900 XT226 FPSअनुमानित 80%RTX 5070134 FPSअनुमानित 74%RX 7900 XT161 FPSअनुमानित 74%RTX 5070125 FPSअनुमानित 74%RX 7900 XT150 FPSअनुमानित 74%RTX 5070101 FPSअनुमानित 74%RX 7900 XT122 FPSअनुमानित 74%
God of War RagnarökRTX 507030 FPSअनुमानित 66%RX 7900 XT36 FPSअनुमानित 66%RTX 507026 FPSअनुमानित 66%RX 7900 XT31 FPSअनुमानित 66%RTX 507019 FPSअनुमानित 66%RX 7900 XT23 FPSअनुमानित 66%RTX 507011 FPSअनुमानित 66%RX 7900 XT13 FPSअनुमानित 66%
Hogwarts LegacyRTX 5070134 FPSअनुमानित 74%RX 7900 XT161 FPSअनुमानित 74%RTX 5070112 FPSअनुमानित 74%RX 7900 XT134 FPSअनुमानित 74%RTX 507090 FPSअनुमानित 74%RX 7900 XT108 FPSअनुमानित 74%RTX 507047 FPSअनुमानित 74%RX 7900 XT56 FPSअनुमानित 74%
Microsoft Flight Simulator 2024RTX 507030 FPSअनुमानित 66%RX 7900 XT36 FPSअनुमानित 66%RTX 507026 FPSअनुमानित 66%RX 7900 XT31 FPSअनुमानित 66%RTX 507019 FPSअनुमानित 66%RX 7900 XT23 FPSअनुमानित 66%RTX 507011 FPSअनुमानित 66%RX 7900 XT13 FPSअनुमानित 66%
Monster Hunter WildsRTX 507030 FPSअनुमानित 66%RX 7900 XT36 FPSअनुमानित 66%RTX 507026 FPSअनुमानित 66%RX 7900 XT31 FPSअनुमानित 66%RTX 507019 FPSअनुमानित 66%RX 7900 XT23 FPSअनुमानित 66%RTX 507011 FPSअनुमानित 66%RX 7900 XT13 FPSअनुमानित 66%
StarfieldRTX 507030 FPSअनुमानित 66%RX 7900 XT36 FPSअनुमानित 66%RTX 507026 FPSअनुमानित 66%RX 7900 XT31 FPSअनुमानित 66%RTX 507019 FPSअनुमानित 66%RX 7900 XT23 FPSअनुमानित 66%RTX 507011 FPSअनुमानित 66%RX 7900 XT13 FPSअनुमानित 66%
HEAD TO HEAD · गणना सूचकांक
H2H workload indices
निश्चित 0–100 scale पर तुलनीय आंतरिक indices.
«बेंचमार्क» सेक्शन सामान्यीकृत H2H डेटा से RTX 5070 और RX 7900 XT की तुलना करता है और स्पेसिफिकेशन, टेस्ट व वैल्यू संकेतों को व्यावहारिक खरीद संदर्भ में बदलता है।
H2H Raster IndexH2H Index / 100627316%
H2H Compute IndexH2H Index / 100687712%
H2H Rendering IndexH2H Index / 100677916%
H2H Memory Workload IndexH2H Index / 100809517%
H2H Efficiency IndexH2H Index / 10083778%
ये सामान्यीकृत कैटलॉग डेटा से बने H2H indices हैं; ये बाहरी benchmark परिणाम नहीं हैं।
HEAD TO HEAD · गणना सूचकांक
H2H AI workload indices
उपलब्ध प्रदर्शन और memory डेटा पर आधारित अनुमानित profiles.
«विस्तृत तुलना» सेक्शन सामान्यीकृत H2H डेटा से RTX 5070 और RX 7900 XT की तुलना करता है और स्पेसिफिकेशन, टेस्ट व वैल्यू संकेतों को व्यावहारिक खरीद संदर्भ में बदलता है।
H2H Image Generation IndexH2H Index / 100708317%
H2H ML Training IndexH2H Index / 100698217%
H2H Inference IndexH2H Index / 100677916%
H2H Local LLM IndexH2H Index / 100728517%
H2H Computer Vision IndexH2H Index / 100677916%
ये सामान्यीकृत कैटलॉग डेटा से बने H2H indices हैं; ये बाहरी benchmark परिणाम नहीं हैं।
ग्राफिक्स API, SDK और अपस्केलिंग
«ग्राफिक्स API, SDK और अपस्केलिंग» सेक्शन सामान्यीकृत H2H डेटा से RTX 5070 और RX 7900 XT की तुलना करता है और स्पेसिफिकेशन, टेस्ट व वैल्यू संकेतों को व्यावहारिक खरीद संदर्भ में बदलता है।
DirectX12.212.2
Vulkan1.41.4
OpenGL4.64.6
अपस्केलिंगDLSS 4FSR
Compute APIOpenCL 3.0, CUDA 12.0OpenCL 2.2
आर्किटेक्चर और रिलीज़
«आर्किटेक्चर और रिलीज़» सेक्शन सामान्यीकृत H2H डेटा से RTX 5070 और RX 7900 XT की तुलना करता है और स्पेसिफिकेशन, टेस्ट व वैल्यू संकेतों को व्यावहारिक खरीद संदर्भ में बदलता है।
आर्किटेक्चरBlackwell 2.0RDNA 3.0बेहतर
प्रक्रिया नोड4 nmबेहतर5 nm
रिलीज़ तारीख20252022
Device classDesktopDesktop
GPU कोर, डाई और क्लॉक
«कोर और क्लॉक» सेक्शन सामान्यीकृत H2H डेटा से RTX 5070 और RX 7900 XT की तुलना करता है और स्पेसिफिकेशन, टेस्ट व वैल्यू संकेतों को व्यावहारिक खरीद संदर्भ में बदलता है।
ट्रांजिस्टर संख्या31100 million57700 millionबेहतर
डाई आकार263 mm²बेहतर529 mm²
शेडर यूनिट / कोर6144बेहतर5376
बेस क्लॉक2325 MHzबेहतर1500 MHz
बूस्ट क्लॉक2512 MHzबेहतर2400 MHz
बोर्ड आकार, पावर और संगतता
«फॉर्म फैक्टर और संगतता» सेक्शन सामान्यीकृत H2H डेटा से RTX 5070 और RX 7900 XT की तुलना करता है और स्पेसिफिकेशन, टेस्ट व वैल्यू संकेतों को व्यावहारिक खरीद संदर्भ में बदलता है।
इंटरफ़ेसPCIe 5x16PCIe 4x16
लंबाई245 mmबेहतर276 mm
मोटाईDual-slotDual-slot
अनुशंसित PSU600 Wबेहतर700 W
पावर कनेक्टर16 pin8+8 pin
डिस्प्ले आउटपुट और सीमाएँ
«डिस्प्ले आउटपुट» सेक्शन सामान्यीकृत H2H डेटा से RTX 5070 और RX 7900 XT की तुलना करता है और स्पेसिफिकेशन, टेस्ट व वैल्यू संकेतों को व्यावहारिक खरीद संदर्भ में बदलता है।
HDMIHDMI 2.1bHDMI 2.1a
DisplayPortDisplayPort 2.1bDisplayPort 2.1
USB Type-Cनहींहाँ
अधिकतम मॉनिटर44
अधिकतम रिज़ॉल्यूशन7680 × 43207680 × 4320
मेमोरी और कंप्यूट throughput
«VRAM और बैंडविड्थ» सेक्शन सामान्यीकृत H2H डेटा से RTX 5070 और RX 7900 XT की तुलना करता है और स्पेसिफिकेशन, टेस्ट व वैल्यू संकेतों को व्यावहारिक खरीद संदर्भ में बदलता है।
वीडियो मेमोरी12 GB GDDR720 GB GDDR6बेहतर
मेमोरी प्रकारGDDR7GDDR6
मेमोरी बस192 bit320 bitबेहतर
TFLOPS30.8751.48बेहतर
HEAD TO HEAD · खोजें
6अन्य तुलनाएँ
 Arc A310Intel
Reviews and questions
AI व्याख्या · HEAD TO HEAD
इस तुलना को समझाएँ
प्रतिशत से आगे: हर चार्ट के कारण, महत्वपूर्ण स्पेसिफिकेशन और व्यावहारिक असर।
AI क्या समझाएगा
कुल स्कोर, रडार, FPS, सिंथेटिक टेस्ट, स्पेसिफिकेशन, दक्षता और वैल्यू।
वास्तविक कॉन्फ़िगरेशन
मालिकों के अनुभव
वास्तविक बिल्ड, परिणाम और समुदाय की प्रतिक्रिया।
♢मॉडरेटर द्वारा समीक्षा की गई☆समुदाय के लिए उपयोगी🏅विशेषज्ञ बैज
तुलना के सामान्य प्रश्न
Short recommendations based on performance, memory, power consumption, and intended use.
01Which is better for gaming: RTX 5070 or RX 7900 XT?+
RX 7900 XT has the higher overall gaming score, while RX 7900 XT offers the better price-to-performance ratio. The final choice depends on resolution and settings.
02Which is better for streaming?+
RTX 5070 is the stronger streaming choice thanks to performance, hardware encoding, and application support. Check AV1, H.264, and HEVC support before buying.
03Which is better for Blender?+
RTX 5070 is generally the better option for Blender and GPU rendering. Rendering-engine support and available VRAM also matter.
04Which is better for video editing?+
RX 7900 XT offers more overall performance, while RTX 5070 offers more memory headroom. Codecs, hardware encoders, and editor optimization can change the result.
05Which is better for neural networks and AI?+
RTX 5070 is the more practical option for local AI workloads. VRAM capacity, compute libraries, and framework compatibility are especially important.
06Which is better for 1080p?+
RX 7900 XT is the most rational 1080p choice, where high frame rates and cost per frame matter most.
07Which is better for 1440p?+
RX 7900 XT leads in combined 1440p performance. RTX 5070 can be preferable for heavy textures and games with high VRAM usage.
08Which is better for 4K?+
RX 7900 XT is preferable for 4K, where total performance, memory bandwidth, and VRAM capacity have the greatest impact.
09Which is better for a quiet PC?+
RTX 5070 is easier to use in a quiet build because of its lower estimated power and thermal load. Actual noise depends on the specific cooler.
10Which is better without replacing the power supply?+
RTX 5070 is the safer candidate because its stated power consumption is lower. Verify PSU wattage, age, and power connectors.
11Is it worth upgrading from the previous generation?+
Consider upgrading to RX 7900 XT if your current device no longer delivers the required FPS, memory capacity, or feature support. A gain below 15–20% is usually worth waiting for a price cut.