
Intel

Intel Arc A380 vs GeForce RTX 2080 SUPER
Perbandingan lengkap spesifikasi, performa, dan benchmark
NVIDIA
RTX 2080 SUPER
Skor performa agregat
Kami membandingkan Arc A380 dan RTX 2080 SUPER berdasarkan spesifikasi dan pengujian relevan.
↗RTX 2080 SUPER unggul 31% atas Arc A380 menurut indeks agregat Head to Head.+31%
Skor dinormalisasi pada skala Head to Head. Lebih tinggi lebih baik.Intel Arc A380 vs GeForce RTX 2080 SUPER: kesimpulan utama
Perbandingan Arc A380 dan RTX 2080 SUPER menunjukkan keunggulan 31% untuk RTX 2080 SUPER pada «performa gaming», sementara Arc A380 bisa lebih baik pada «nilai untuk uang». Bagian di bawah membantu melihat apakah selisih berasal dari FPS, spesifikasi, efisiensi, harga, atau platform.
PROFIL RINGKAS
Radar metrik terverifikasi
Sumbu tanpa data disembunyikan; setiap nilai memakai skala tetap.
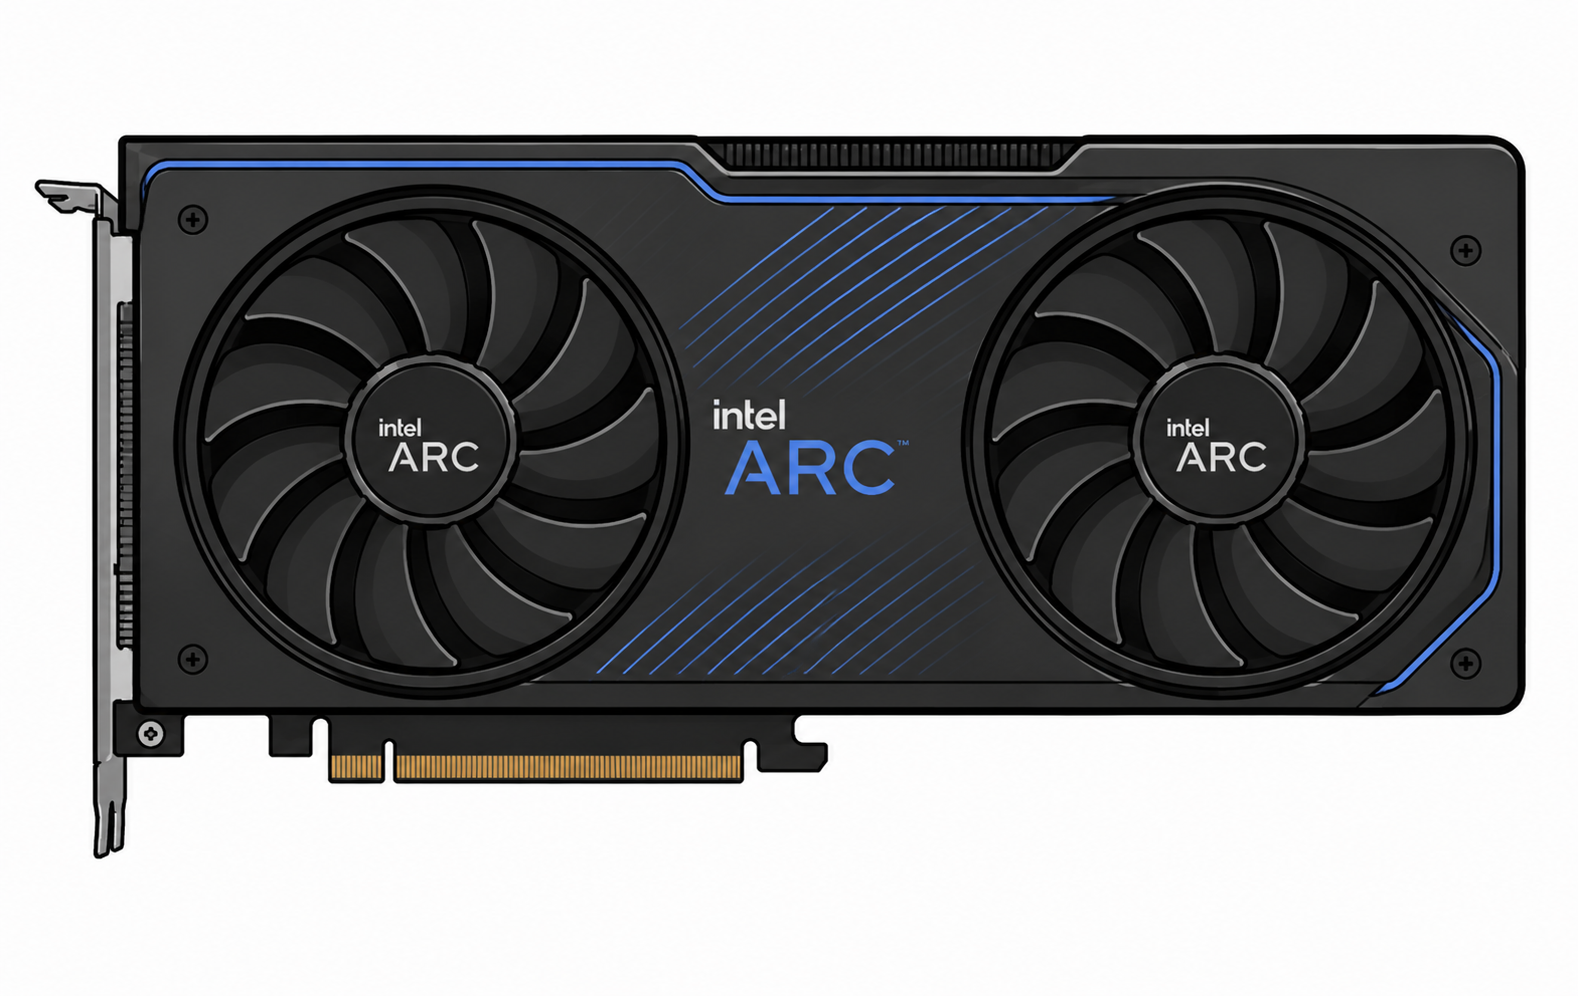 Intel
Intel NVIDIA
Performa
Efisiensi
Harga / performa
Kapasitas memori
3647
10063
100100
6068
HASIL PERBANDINGAN
Kedua perangkat mendapat skor keseluruhan yang sama
Arc A380 unggul dalam performa game gabungan. Arc A380 menawarkan harga per frame lebih baik; pilihan akhir bergantung pada fitur, memori, dan game.
Performa hampir sama
Arc A380 lebih murah
POSISI KATALOG
Peringkat lengkap →Peringkat kartu grafis
Posisi 126–131dari 317
KESIMPULAN PERBANDINGAN
Mana yang sebaiknya dipilih?
Dua kesimpulan praktis berdasarkan suara komunitas dan nilai gaming.
GeForce RTX 2080 SUPER
168 sukaPengunjung Head to Head saat ini lebih sering memilih model ini.
Intel Arc A380
100/100 · Harga $139Pilihan didasarkan pada indeks harga-performa dan harga peluncuran.
SKOR KESELURUHAN
Ringkasan
Scores are calculated from specifications, performance, and efficiency.
Bagian «Skor ringkasan» membandingkan Arc A380 dan RTX 2080 SUPER dengan data H2H ternormalisasi, lalu mengubah spesifikasi, tes, dan nilai menjadi konteks pembelian praktis.
GamePerforma DirectX, OpenCL, dan Vulkan
36
47Lebih baik
Aplikasi profesionalModeling 3D, editing video, dan rendering
32
40Lebih baik
AI dan machine learningKemampuan machine learning dan AI
30
38Lebih baik
Efisiensi dayaKonsumsi daya di berbagai beban
100Lebih baik
63
Skor Head to HeadSkor katalog keseluruhan
60
60
PERBANDINGAN LENGKAP
Spesifikasi
The better numeric value is highlighted in green, taking the metric direction into account.
Bagian «Spesifikasi» membandingkan Arc A380 dan RTX 2080 SUPER dengan data H2H ternormalisasi, lalu mengubah spesifikasi, tes, dan nilai menjadi konteks pembelian praktis.
DisplayPortDisplayPort 2.0DisplayPort 1.4a
HDMIHDMI 2.1HDMI 2.0
Device classDesktopDesktop
UpscalingXeSSDLSS 2
DirectX12.212.2
Vulkan1.41.4
OpenGL4.64.6
TFLOPS4.19811.15Lebih baik
Konsumsi daya75 WLebih baik250 W
Jenis memoriGDDR6GDDR6
Konektor daya6 pin6+8 pin
Tanggal rilis20222019
ArsitekturXe-HPGTuring
KetebalanDual-slotDual-slot
Compute APIOpenCL 3.0OpenCL 3.0, CUDA 7.5
Harga peluncuran$139Lebih baik$699
Unit shader / core10243072Lebih baik
Kecepatan clock300 - 2000 MHz1650 - 1815 MHzLebih baik
Clock dasar300 MHz1650 MHzLebih baik
Boost clock2000 MHzLebih baik1815 MHz
Memori video6 GB GDDR68 GB GDDR6Lebih baik
Frekuensi memori15,5 GHz15,5 GHz
Bus memori96 bit256 bitLebih baik
Bandwidth memori186 GB/s496 GB/sLebih baik
AntarmukaPCIe 4x8PCIe 3x16
Konsumsi daya75 WLebih baik250 W
Node proses6 nmLebih baik12 nm
PSU yang disarankan250 WLebih baik600 W
Panjang222 mmLebih baik267 mm
Ukuran die157 mm²Lebih baik545 mm²
Cache memoriL2 4 MBLebih baikL1 64 KB, L2 4 MB
Jumlah transistor7200 million13600 millionLebih baik
Monitor maksimum45
Resolusi maksimum7680 × 43207680 × 4320
USB Type-CTidakYa
GAME TEST BENCH
FPS game
Available results are shown separately; missing data is not treated as zero.
Bagian FPS game membandingkan Arc A380 dan RTX 2080 SUPER pada preset H2H Lab yang dikurasi. Sinyal penting bukan hanya FPS rata-rata: perhatikan juga perilaku di 1440p dan 4K, pengaruh kapasitas memori dan lebar bus pada tekstur berat, stabilitas 1% low, serta apakah engine game lebih menyukai raster, ray tracing, atau kematangan driver.
Arc A380RTX 2080 SUPER
Terverifikasi H2HTerverifikasi komunitasEstimasiPrediksi
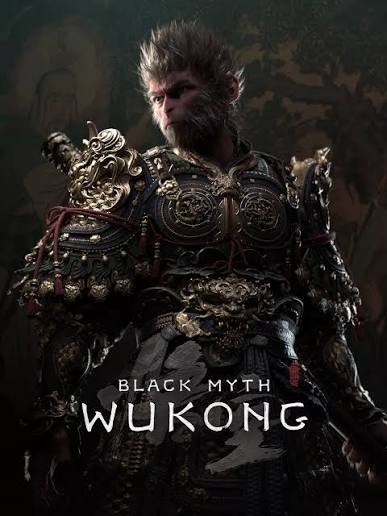
Black Myth: Wukong
1080p High
22 FPSEstimasi 66%
24 FPSEstimasi 66%
1080p Ultra
19 FPSEstimasi 66%
21 FPSEstimasi 66%
1440p Ultra
10 FPSEstimasi 59%
15 FPSEstimasi 66%
4K Ultra
5 FPSEstimasi 55%
7 FPSEstimasi 61%
Black Myth: WukongArc A38022 FPSEstimasi 66%RTX 2080 SUPER24 FPSEstimasi 66%Arc A38019 FPSEstimasi 66%RTX 2080 SUPER21 FPSEstimasi 66%Arc A38010 FPSEstimasi 59%RTX 2080 SUPER15 FPSEstimasi 66%Arc A3805 FPSEstimasi 55%RTX 2080 SUPER7 FPSEstimasi 61%
Call of Duty: WarzoneArc A38022 FPSEstimasi 66%RTX 2080 SUPER24 FPSEstimasi 66%Arc A38019 FPSEstimasi 66%RTX 2080 SUPER21 FPSEstimasi 66%Arc A38010 FPSEstimasi 59%RTX 2080 SUPER15 FPSEstimasi 66%Arc A3805 FPSEstimasi 55%RTX 2080 SUPER7 FPSEstimasi 61%
Counter-Strike 2Arc A380188 FPSEstimasi 74%RTX 2080 SUPER204 FPSEstimasi 74%Arc A380129 FPSEstimasi 74%RTX 2080 SUPER143 FPSEstimasi 74%Arc A38069 FPSEstimasi 67%RTX 2080 SUPER111 FPSEstimasi 74%Arc A38023 FPSEstimasi 62%RTX 2080 SUPER43 FPSEstimasi 69%
Cyberpunk 2077Arc A380121 FPSEstimasi 74%RTX 2080 SUPER131 FPSEstimasi 74%Arc A380102 FPSEstimasi 74%RTX 2080 SUPER113 FPSEstimasi 74%Arc A38050 FPSEstimasi 67%RTX 2080 SUPER81 FPSEstimasi 74%Arc A38015 FPSEstimasi 62%RTX 2080 SUPER29 FPSEstimasi 69%
Forza Horizon 5Arc A380153 FPSEstimasi 80%RTX 2080 SUPER166 FPSEstimasi 80%Arc A38097 FPSEstimasi 74%RTX 2080 SUPER107 FPSEstimasi 74%Arc A38062 FPSEstimasi 67%RTX 2080 SUPER100 FPSEstimasi 74%Arc A38034 FPSEstimasi 62%RTX 2080 SUPER63 FPSEstimasi 69%
God of War RagnarökArc A38022 FPSEstimasi 66%RTX 2080 SUPER24 FPSEstimasi 66%Arc A38019 FPSEstimasi 66%RTX 2080 SUPER21 FPSEstimasi 66%Arc A38010 FPSEstimasi 59%RTX 2080 SUPER15 FPSEstimasi 66%Arc A3805 FPSEstimasi 55%RTX 2080 SUPER7 FPSEstimasi 61%
Hogwarts LegacyArc A38099 FPSEstimasi 74%RTX 2080 SUPER107 FPSEstimasi 74%Arc A38081 FPSEstimasi 74%RTX 2080 SUPER90 FPSEstimasi 74%Arc A38045 FPSEstimasi 67%RTX 2080 SUPER72 FPSEstimasi 74%Arc A38016 FPSEstimasi 62%RTX 2080 SUPER29 FPSEstimasi 69%
Microsoft Flight Simulator 2024Arc A38022 FPSEstimasi 66%RTX 2080 SUPER24 FPSEstimasi 66%Arc A38019 FPSEstimasi 66%RTX 2080 SUPER21 FPSEstimasi 66%Arc A38010 FPSEstimasi 59%RTX 2080 SUPER15 FPSEstimasi 66%Arc A3805 FPSEstimasi 55%RTX 2080 SUPER7 FPSEstimasi 61%
Monster Hunter WildsArc A38022 FPSEstimasi 66%RTX 2080 SUPER24 FPSEstimasi 66%Arc A38019 FPSEstimasi 66%RTX 2080 SUPER21 FPSEstimasi 66%Arc A38010 FPSEstimasi 59%RTX 2080 SUPER15 FPSEstimasi 66%Arc A3805 FPSEstimasi 55%RTX 2080 SUPER7 FPSEstimasi 61%
StarfieldArc A38022 FPSEstimasi 66%RTX 2080 SUPER24 FPSEstimasi 66%Arc A38019 FPSEstimasi 66%RTX 2080 SUPER21 FPSEstimasi 66%Arc A38010 FPSEstimasi 59%RTX 2080 SUPER15 FPSEstimasi 66%Arc A3805 FPSEstimasi 55%RTX 2080 SUPER7 FPSEstimasi 61%
HEAD TO HEAD · INDEKS TERHITUNG
Indeks workload H2H
Indeks internal sebanding pada skala tetap 0–100.
Bagian «Benchmark» membandingkan Arc A380 dan RTX 2080 SUPER dengan data H2H ternormalisasi, lalu mengubah spesifikasi, tes, dan nilai menjadi konteks pembelian praktis.
H2H Raster IndexH2H Index / 100364727%
H2H Compute IndexH2H Index / 100445217%
H2H Rendering IndexH2H Index / 100435321%
H2H Memory Workload IndexH2H Index / 100606813%
H2H Efficiency IndexH2H Index / 1001006345%
Indeks H2H dari data katalog ternormalisasi; bukan hasil benchmark pihak ketiga.
HEAD TO HEAD · INDEKS TERHITUNG
Indeks workload AI H2H
Profil estimasi berdasarkan data performa dan memori yang tersedia.
Bagian «Perbandingan detail» membandingkan Arc A380 dan RTX 2080 SUPER dengan data H2H ternormalisasi, lalu mengubah spesifikasi, tes, dan nilai menjadi konteks pembelian praktis.
H2H Image Generation IndexH2H Index / 100475719%
H2H ML Training IndexH2H Index / 100465620%
H2H Inference IndexH2H Index / 100435321%
H2H Local LLM IndexH2H Index / 100495919%
H2H Computer Vision IndexH2H Index / 100435321%
Indeks H2H dari data katalog ternormalisasi; bukan hasil benchmark pihak ketiga.
API grafis, SDK, dan upscaling
Bagian «API grafis, SDK, dan upscaling» membandingkan Arc A380 dan RTX 2080 SUPER dengan data H2H ternormalisasi, lalu mengubah spesifikasi, tes, dan nilai menjadi konteks pembelian praktis.
DirectX12.212.2
Vulkan1.41.4
OpenGL4.64.6
UpscalingXeSSDLSS 2
Compute APIOpenCL 3.0OpenCL 3.0, CUDA 7.5
Arsitektur dan rilis
Bagian «Arsitektur dan rilis» membandingkan Arc A380 dan RTX 2080 SUPER dengan data H2H ternormalisasi, lalu mengubah spesifikasi, tes, dan nilai menjadi konteks pembelian praktis.
ArsitekturXe-HPGTuring
Node proses6 nmLebih baik12 nm
Tanggal rilis20222019
Device classDesktopDesktop
Core GPU, die, dan clock
Bagian «Core dan clock» membandingkan Arc A380 dan RTX 2080 SUPER dengan data H2H ternormalisasi, lalu mengubah spesifikasi, tes, dan nilai menjadi konteks pembelian praktis.
Jumlah transistor7200 million13600 millionLebih baik
Ukuran die157 mm²Lebih baik545 mm²
Unit shader / core10243072Lebih baik
Clock dasar300 MHz1650 MHzLebih baik
Boost clock2000 MHzLebih baik1815 MHz
Ukuran board, daya, dan kompatibilitas
Bagian «Form factor dan kompatibilitas» membandingkan Arc A380 dan RTX 2080 SUPER dengan data H2H ternormalisasi, lalu mengubah spesifikasi, tes, dan nilai menjadi konteks pembelian praktis.
AntarmukaPCIe 4x8PCIe 3x16
Panjang222 mmLebih baik267 mm
KetebalanDual-slotDual-slot
PSU yang disarankan250 WLebih baik600 W
Konektor daya6 pin6+8 pin
Output display dan batas
Bagian «Output display» membandingkan Arc A380 dan RTX 2080 SUPER dengan data H2H ternormalisasi, lalu mengubah spesifikasi, tes, dan nilai menjadi konteks pembelian praktis.
HDMIHDMI 2.1HDMI 2.0
DisplayPortDisplayPort 2.0DisplayPort 1.4a
USB Type-CTidakYa
Monitor maksimum45
Resolusi maksimum7680 × 43207680 × 4320
Memori dan throughput komputasi
Bagian «VRAM dan bandwidth» membandingkan Arc A380 dan RTX 2080 SUPER dengan data H2H ternormalisasi, lalu mengubah spesifikasi, tes, dan nilai menjadi konteks pembelian praktis.
Memori video6 GB GDDR68 GB GDDR6Lebih baik
Jenis memoriGDDR6GDDR6
Bus memori96 bit256 bitLebih baik
TFLOPS4.19811.15Lebih baik
HEAD TO HEAD · JELAJAHI
6Perbandingan lain
 Navi II 2CU 7xxx/9xxxAMD
Reviews and questions
PENJELASAN AI · HEAD TO HEAD
Jelaskan perbandingan ini
Lebih dari persentase: penyebab, spesifikasi relevan, dan dampak praktis di balik setiap grafik.
Apa yang akan dijelaskan AI
Skor keseluruhan, radar, FPS, tes sintetis, spesifikasi, efisiensi, dan nilai.
KONFIGURASI NYATA
Pengalaman pemilik
Rakitan nyata, hasil, dan masukan komunitas.
♢Ditinjau moderator☆Bermanfaat bagi komunitas🏅Lencana ahli
Pertanyaan umum perbandingan
Short recommendations based on performance, memory, power consumption, and intended use.
01Which is better for gaming: Arc A380 or RTX 2080 SUPER?+
Arc A380 has the higher overall gaming score, while Arc A380 offers the better price-to-performance ratio. The final choice depends on resolution and settings.
02Which is better for streaming?+
RTX 2080 SUPER is the stronger streaming choice thanks to performance, hardware encoding, and application support. Check AV1, H.264, and HEVC support before buying.
03Which is better for Blender?+
RTX 2080 SUPER is generally the better option for Blender and GPU rendering. Rendering-engine support and available VRAM also matter.
04Which is better for video editing?+
Arc A380 offers more overall performance, while Arc A380 offers more memory headroom. Codecs, hardware encoders, and editor optimization can change the result.
05Which is better for neural networks and AI?+
RTX 2080 SUPER is the more practical option for local AI workloads. VRAM capacity, compute libraries, and framework compatibility are especially important.
06Which is better for 1080p?+
Arc A380 is the most rational 1080p choice, where high frame rates and cost per frame matter most.
07Which is better for 1440p?+
Arc A380 leads in combined 1440p performance. Arc A380 can be preferable for heavy textures and games with high VRAM usage.
08Which is better for 4K?+
Arc A380 is preferable for 4K, where total performance, memory bandwidth, and VRAM capacity have the greatest impact.
09Which is better for a quiet PC?+
Arc A380 is easier to use in a quiet build because of its lower estimated power and thermal load. Actual noise depends on the specific cooler.
10Which is better without replacing the power supply?+
Arc A380 is the safer candidate because its stated power consumption is lower. Verify PSU wattage, age, and power connectors.
11Is it worth upgrading from the previous generation?+
Consider upgrading to Arc A380 if your current device no longer delivers the required FPS, memory capacity, or feature support. A gain below 15–20% is usually worth waiting for a price cut.