
NVIDIA

GeForce RTX 5070 Ti SUPER vs Radeon RX 5500 XT
Confronto completo di specifiche, prestazioni e benchmark
AMD
RX 5500 XT
Punteggio aggregato delle prestazioni
Abbiamo confrontato RTX 5070 Ti SUPER e RX 5500 XT per specifiche e test rilevanti.
↗RTX 5070 Ti SUPER supera RX 5500 XT del 90% secondo l’indice aggregato Head to Head.+90%
I punteggi sono normalizzati sulla scala Head to Head. Più alto è meglio.GeForce RTX 5070 Ti SUPER vs Radeon RX 5500 XT: conclusione chiave
Il confronto tra RTX 5070 Ti SUPER e RX 5500 XT mostra un vantaggio del 90% per RTX 5070 Ti SUPER in «prestazioni nei giochi», mentre RX 5500 XT può essere migliore in «rapporto qualità-prezzo». Le sezioni sotto spiegano se il divario nasce da FPS, specifiche, efficienza, prezzo o piattaforma.
PROFILO RIASSUNTIVO
Radar delle metriche verificate
Gli assi senza dati sono nascosti; ogni valore usa una scala fissa.
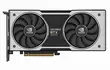 NVIDIA
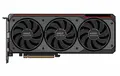 AMD
AMDPrestazioni
Efficienza
Prezzo / prestazioni
Capacità memoria
7439
70100
69100
10068
RISULTATO DEL CONFRONTO
RTX 5070 Ti SUPER è la scelta migliore in generale
RTX 5070 Ti SUPER guida nelle prestazioni combinate nei giochi. RX 5500 XT offre il miglior prezzo per frame; la scelta finale dipende da funzioni, memoria e giochi.
RTX 5070 Ti SUPER guida nell’indice combinato
RX 5500 XT costa meno
POSIZIONE NEL CATALOGO
Classifica completa →Classifica schede video
Posizioni 16–21di 317
VERDETTO DEL CONFRONTO
Quale scegliere?
Due conclusioni pratiche basate sui voti della community e sul valore nei giochi.
GeForce RTX 5070 Ti SUPER
121 Mi piaceI visitatori di Head to Head scelgono attualmente questo modello più spesso.
Radeon RX 5500 XT
100/100 · Prezzo $229La scelta si basa sull’indice prezzo/prestazioni e sul prezzo di lancio.
PUNTEGGIO COMPLESSIVO
Panoramica
Scores are calculated from specifications, performance, and efficiency.
La sezione «Punteggio riepilogativo» confronta RTX 5070 Ti SUPER e RX 5500 XT con dati H2H normalizzati e trasforma specifiche, test e valore in contesto pratico d’acquisto.
GiochiPrestazioni DirectX, OpenCL e Vulkan
74Migliore
39
Applicazioni professionaliModellazione 3D, montaggio video e rendering
60Migliore
34
IA e machine learningCapacità di machine learning e IA
57Migliore
32
Efficienza energeticaConsumo in diversi carichi
70
100Migliore
Punteggio Head to HeadPunteggio complessivo del catalogo
72Migliore
62
CONFRONTO COMPLETO
Specifiche
The better numeric value is highlighted in green, taking the metric direction into account.
La sezione «Specifiche» confronta RTX 5070 Ti SUPER e RX 5500 XT con dati H2H normalizzati e trasforma specifiche, test e valore in contesto pratico d’acquisto.
Release statusannounced—
HDMIHDMI 2.1bHDMI 2.0b
Device classDesktopDesktop
DirectX12.212.1
Vulkan1.41.4
OpenGL4.64.6
UpscalingDLSS 4FSR
API di calcoloOpenCL 3.0, CUDA 12.0OpenCL 2.1
DisplayPortDisplayPort 2.1bDisplayPort 1.4a
TFLOPS52Migliore5.196
Consumo energetico350 W130 WMigliore
Tipo di memoriaGDDR7GDDR6
Connettore di alimentazione16 pin8 pin
Data di uscita20262019
Prezzo di lancio—$229
Frequenza2295 - 2452 MHzMigliore1607 - 1845 MHz
Frequenza base2295 MHzMigliore1607 MHz
Frequenza boost2452 MHzMigliore1845 MHz
Memoria video24 GB GDDR7Migliore8 GB GDDR6
Frequenza memoria28 GHzMigliore14 GHz
Bus di memoria256 bitMigliore128 bit
Banda memoria896 GB/sMigliore224 GB/s
InterfacciaPCIe 5x16PCIe 4x8
Consumo energetico350 W130 WMigliore
Processo produttivo4 nmMigliore7 nm
Monitor massimi14
Risoluzione massima7680 × 43207680 × 4320
USB Type-CNoNo
PSU consigliatoVaries by board300 W
LunghezzaVaries by board180 mm
SpessoreVaries by boardDual-slot
ArchitetturaNot publicly specifiedRDNA 1.0
Numero di transistorNot publicly specified6400 million
Dimensione del dieNot publicly specified158 mm²
Unità shader / coreNot publicly specified1408
Cache memoriaNot publicly specifiedL2 2 MB
GAME TEST BENCH
FPS nei giochi
Available results are shown separately; missing data is not treated as zero.
La sezione FPS nei giochi confronta RTX 5070 Ti SUPER e RX 5500 XT con preset selezionati di H2H Lab. Il segnale utile non è solo l’FPS medio: contano anche 1440p e 4K, memoria e bus con texture pesanti, stabilità dell’1% low e se il motore favorisce raster, ray tracing o driver maturi.
RTX 5070 Ti SUPERRX 5500 XT
Verificato H2HVerificato dalla communityStimatoPrevisto

Black Myth: Wukong
1080p High
36 FPSStimato 66%
23 FPSStimato 66%
1080p Ultra
31 FPSStimato 66%
19 FPSStimato 66%
1440p Ultra
23 FPSStimato 66%
12 FPSStimato 63%
4K Ultra
13 FPSStimato 66%
5 FPSStimato 55%
Black Myth: WukongRTX 5070 Ti SUPER36 FPSStimato 66%RX 5500 XT23 FPSStimato 66%RTX 5070 Ti SUPER31 FPSStimato 66%RX 5500 XT19 FPSStimato 66%RTX 5070 Ti SUPER23 FPSStimato 66%RX 5500 XT12 FPSStimato 63%RTX 5070 Ti SUPER13 FPSStimato 66%RX 5500 XT5 FPSStimato 55%
Call of Duty: WarzoneRTX 5070 Ti SUPER36 FPSStimato 66%RX 5500 XT23 FPSStimato 66%RTX 5070 Ti SUPER31 FPSStimato 66%RX 5500 XT19 FPSStimato 66%RTX 5070 Ti SUPER23 FPSStimato 66%RX 5500 XT12 FPSStimato 63%RTX 5070 Ti SUPER13 FPSStimato 66%RX 5500 XT5 FPSStimato 55%
Counter-Strike 2RTX 5070 Ti SUPER306 FPSStimato 74%RX 5500 XT190 FPSStimato 74%RTX 5070 Ti SUPER215 FPSStimato 74%RX 5500 XT133 FPSStimato 74%RTX 5070 Ti SUPER167 FPSStimato 74%RX 5500 XT89 FPSStimato 71%RTX 5070 Ti SUPER83 FPSStimato 74%RX 5500 XT26 FPSStimato 63%
Cyberpunk 2077RTX 5070 Ti SUPER197 FPSStimato 74%RX 5500 XT122 FPSStimato 74%RTX 5070 Ti SUPER170 FPSStimato 74%RX 5500 XT105 FPSStimato 74%RTX 5070 Ti SUPER121 FPSStimato 74%RX 5500 XT64 FPSStimato 71%RTX 5070 Ti SUPER56 FPSStimato 74%RX 5500 XT17 FPSStimato 63%
Forza Horizon 5RTX 5070 Ti SUPER227 FPSStimato 80%RX 5500 XT154 FPSStimato 80%RTX 5070 Ti SUPER161 FPSStimato 74%RX 5500 XT100 FPSStimato 74%RTX 5070 Ti SUPER151 FPSStimato 74%RX 5500 XT80 FPSStimato 71%RTX 5070 Ti SUPER122 FPSStimato 74%RX 5500 XT38 FPSStimato 63%
God of War RagnarökRTX 5070 Ti SUPER36 FPSStimato 66%RX 5500 XT23 FPSStimato 66%RTX 5070 Ti SUPER31 FPSStimato 66%RX 5500 XT19 FPSStimato 66%RTX 5070 Ti SUPER23 FPSStimato 66%RX 5500 XT12 FPSStimato 63%RTX 5070 Ti SUPER13 FPSStimato 66%RX 5500 XT5 FPSStimato 55%
Hogwarts LegacyRTX 5070 Ti SUPER161 FPSStimato 74%RX 5500 XT100 FPSStimato 74%RTX 5070 Ti SUPER135 FPSStimato 74%RX 5500 XT84 FPSStimato 74%RTX 5070 Ti SUPER108 FPSStimato 74%RX 5500 XT58 FPSStimato 71%RTX 5070 Ti SUPER57 FPSStimato 74%RX 5500 XT18 FPSStimato 63%
Microsoft Flight Simulator 2024RTX 5070 Ti SUPER36 FPSStimato 66%RX 5500 XT23 FPSStimato 66%RTX 5070 Ti SUPER31 FPSStimato 66%RX 5500 XT19 FPSStimato 66%RTX 5070 Ti SUPER23 FPSStimato 66%RX 5500 XT12 FPSStimato 63%RTX 5070 Ti SUPER13 FPSStimato 66%RX 5500 XT5 FPSStimato 55%
Monster Hunter WildsRTX 5070 Ti SUPER36 FPSStimato 66%RX 5500 XT23 FPSStimato 66%RTX 5070 Ti SUPER31 FPSStimato 66%RX 5500 XT19 FPSStimato 66%RTX 5070 Ti SUPER23 FPSStimato 66%RX 5500 XT12 FPSStimato 63%RTX 5070 Ti SUPER13 FPSStimato 66%RX 5500 XT5 FPSStimato 55%
StarfieldRTX 5070 Ti SUPER36 FPSStimato 66%RX 5500 XT23 FPSStimato 66%RTX 5070 Ti SUPER31 FPSStimato 66%RX 5500 XT19 FPSStimato 66%RTX 5070 Ti SUPER23 FPSStimato 66%RX 5500 XT12 FPSStimato 63%RTX 5070 Ti SUPER13 FPSStimato 66%RX 5500 XT5 FPSStimato 55%
HEAD TO HEAD · INDICE CALCOLATO
Indici workload H2H
Indici interni confrontabili su scala fissa 0–100.
La sezione «Benchmark» confronta RTX 5070 Ti SUPER e RX 5500 XT con dati H2H normalizzati e trasforma specifiche, test e valore in contesto pratico d’acquisto.
H2H Raster IndexH2H Index / 100743962%
H2H Compute IndexH2H Index / 100794751%
H2H Rendering IndexH2H Index / 100814753%
H2H Memory Workload IndexH2H Index / 1001006838%
H2H Efficiency IndexH2H Index / 1007010035%
Indici H2H versionati da dati di catalogo normalizzati; non sono risultati di benchmark esterni.
HEAD TO HEAD · INDICE CALCOLATO
Indici workload IA H2H
Profili stimati in base a prestazioni e memoria disponibili.
La sezione «Confronto dettagliato» confronta RTX 5070 Ti SUPER e RX 5500 XT con dati H2H normalizzati e trasforma specifiche, test e valore in contesto pratico d’acquisto.
H2H Image Generation IndexH2H Index / 100865249%
H2H ML Training IndexH2H Index / 100845149%
H2H Inference IndexH2H Index / 100814753%
H2H Local LLM IndexH2H Index / 100885546%
H2H Computer Vision IndexH2H Index / 100824852%
Indici H2H versionati da dati di catalogo normalizzati; non sono risultati di benchmark esterni.
API grafiche, SDK e upscaling
La sezione «API grafiche, SDK e upscaling» confronta RTX 5070 Ti SUPER e RX 5500 XT con dati H2H normalizzati e trasforma specifiche, test e valore in contesto pratico d’acquisto.
DirectX12.212.1
Vulkan1.41.4
OpenGL4.64.6
UpscalingDLSS 4FSR
API di calcoloOpenCL 3.0, CUDA 12.0OpenCL 2.1
Architettura e lancio
La sezione «Architettura e lancio» confronta RTX 5070 Ti SUPER e RX 5500 XT con dati H2H normalizzati e trasforma specifiche, test e valore in contesto pratico d’acquisto.
ArchitetturaNot publicly specifiedRDNA 1.0
Processo produttivo4 nmMigliore7 nm
Data di uscita20262019
Device classDesktopDesktop
Core GPU, die e frequenze
La sezione «Core e frequenze» confronta RTX 5070 Ti SUPER e RX 5500 XT con dati H2H normalizzati e trasforma specifiche, test e valore in contesto pratico d’acquisto.
Numero di transistorNot publicly specified6400 million
Dimensione del dieNot publicly specified158 mm²
Unità shader / coreNot publicly specified1408
Frequenza base2295 MHzMigliore1607 MHz
Frequenza boost2452 MHzMigliore1845 MHz
Dimensioni scheda, alimentazione e compatibilità
La sezione «Formato e compatibilità» confronta RTX 5070 Ti SUPER e RX 5500 XT con dati H2H normalizzati e trasforma specifiche, test e valore in contesto pratico d’acquisto.
InterfacciaPCIe 5x16PCIe 4x8
LunghezzaVaries by board180 mm
SpessoreVaries by boardDual-slot
PSU consigliatoVaries by board300 W
Connettore di alimentazione16 pin8 pin
Uscite display e limiti
La sezione «Uscite video» confronta RTX 5070 Ti SUPER e RX 5500 XT con dati H2H normalizzati e trasforma specifiche, test e valore in contesto pratico d’acquisto.
HDMIHDMI 2.1bHDMI 2.0b
DisplayPortDisplayPort 2.1bDisplayPort 1.4a
USB Type-CNoNo
Monitor massimi14
Risoluzione massima7680 × 43207680 × 4320
Memoria e throughput di calcolo
La sezione «VRAM e banda» confronta RTX 5070 Ti SUPER e RX 5500 XT con dati H2H normalizzati e trasforma specifiche, test e valore in contesto pratico d’acquisto.
Memoria video24 GB GDDR7Migliore8 GB GDDR6
Tipo di memoriaGDDR7GDDR6
Bus di memoria256 bitMigliore128 bit
TFLOPS52Migliore5.196
HEAD TO HEAD · SCOPRI
6Altri confronti
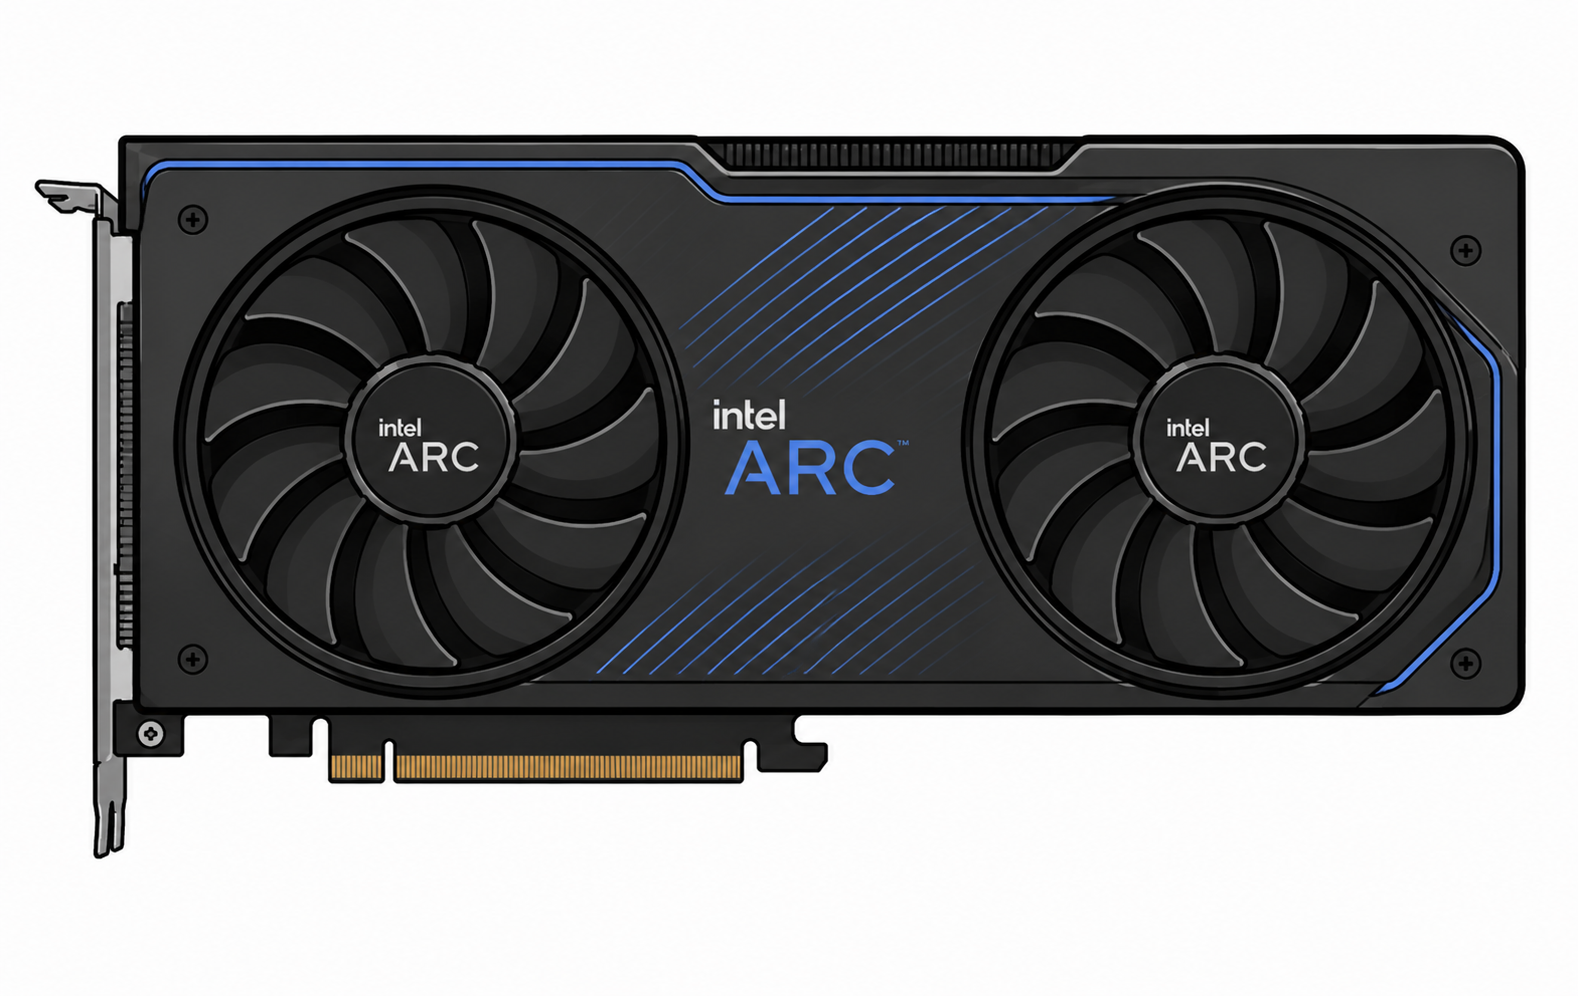 Arc A310Intel
Reviews and questions
SPIEGAZIONE IA · HEAD TO HEAD
Spiega questo confronto
Oltre le percentuali: cause, specifiche rilevanti e impatto pratico dietro ogni grafico.
Cosa spiegherà l’IA
Punteggio complessivo, radar, FPS, test sintetici, specifiche, efficienza e valore.
CONFIGURAZIONI REALI
Esperienze dei proprietari
Build reali, risultati e feedback della community.
♢Revisionato dal moderatore☆Utile alla community🏅Badge esperto
Domande frequenti sul confronto
Short recommendations based on performance, memory, power consumption, and intended use.
01Which is better for gaming: RTX 5070 Ti SUPER or RX 5500 XT?+
RTX 5070 Ti SUPER has the higher overall gaming score, while RX 5500 XT offers the better price-to-performance ratio. The final choice depends on resolution and settings.
02Which is better for streaming?+
RTX 5070 Ti SUPER is the stronger streaming choice thanks to performance, hardware encoding, and application support. Check AV1, H.264, and HEVC support before buying.
03Which is better for Blender?+
RTX 5070 Ti SUPER is generally the better option for Blender and GPU rendering. Rendering-engine support and available VRAM also matter.
04Which is better for video editing?+
RTX 5070 Ti SUPER offers more overall performance, while RTX 5070 Ti SUPER offers more memory headroom. Codecs, hardware encoders, and editor optimization can change the result.
05Which is better for neural networks and AI?+
RTX 5070 Ti SUPER is the more practical option for local AI workloads. VRAM capacity, compute libraries, and framework compatibility are especially important.
06Which is better for 1080p?+
RX 5500 XT is the most rational 1080p choice, where high frame rates and cost per frame matter most.
07Which is better for 1440p?+
RTX 5070 Ti SUPER leads in combined 1440p performance. RTX 5070 Ti SUPER can be preferable for heavy textures and games with high VRAM usage.
08Which is better for 4K?+
RTX 5070 Ti SUPER is preferable for 4K, where total performance, memory bandwidth, and VRAM capacity have the greatest impact.
09Which is better for a quiet PC?+
RX 5500 XT is easier to use in a quiet build because of its lower estimated power and thermal load. Actual noise depends on the specific cooler.
10Which is better without replacing the power supply?+
RX 5500 XT is the safer candidate because its stated power consumption is lower. Verify PSU wattage, age, and power connectors.
11Is it worth upgrading from the previous generation?+
Consider upgrading to RTX 5070 Ti SUPER if your current device no longer delivers the required FPS, memory capacity, or feature support. A gain below 15–20% is usually worth waiting for a price cut.