
NVIDIA

GeForce RTX 3080 Ti vs Radeon RX 5500
Pełne porównanie specyfikacji, wydajności i benchmarków
AMD
RX 5500
Zbiorczy wynik wydajności
Porównaliśmy RTX 3080 Ti i RX 5500 według specyfikacji oraz istotnych testów.
↗RTX 3080 Ti wyprzedza RX 5500 o 81% według zbiorczego indeksu Head to Head.+81%
Wyniki są normalizowane w skali Head to Head. Wyżej znaczy lepiej.GeForce RTX 3080 Ti vs Radeon RX 5500: kluczowy wniosek
Porównanie RTX 3080 Ti i RX 5500 pokazuje przewagę 81% dla RTX 3080 Ti w «wydajność w grach», ale RX 5500 może być lepszy w «opłacalność». Niżej sprawdzisz, czy różnica wynika z FPS, specyfikacji, efektywności, ceny czy platformy.
PROFIL PODSUMOWANIA
Radar zweryfikowanych metryk
Osie bez danych są ukryte; każda wartość używa stałej skali.
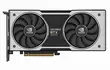 NVIDIA
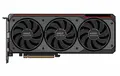 AMD
AMDWydajność
Efektywność
Cena / wydajność
Pojemność pamięci
6737
6482
82100
8060
WYNIK PORÓWNANIA
RTX 3080 Ti to najlepszy wybór ogólny
RTX 3080 Ti prowadzi w łącznej wydajności w grach. RX 5500 oferuje lepszą cenę za klatkę, a ostateczny wybór zależy od funkcji, pamięci i gier.
RTX 3080 Ti prowadzi w indeksie łącznym
RX 5500 kosztuje mniej
POZYCJA W KATALOGU
Pełny ranking →Ranking kart graficznych
Pozycje 60–65z 319
WERDYKT PORÓWNANIA
Co wybrać?
Dwa praktyczne wnioski oparte na głosach społeczności i wartości w grach.
Radeon RX 5500
115 polubieńOdwiedzający Head to Head obecnie częściej wybierają ten model.
Radeon RX 5500
100/100 · Cena $229Wybór opiera się na indeksie ceny do wydajności i cenie premierowej.
OCENA OGÓLNA
Przegląd
Scores are calculated from specifications, performance, and efficiency.
Sekcja «Wynik podsumowania» porównuje RTX 3080 Ti i RX 5500 na podstawie znormalizowanych danych H2H i zamienia specyfikacje, testy oraz opłacalność w praktyczny kontekst wyboru.
GryWydajność DirectX, OpenCL i Vulkan
67Lepsze
37
Aplikacje profesjonalneModelowanie 3D, montaż wideo i rendering
55Lepsze
33
AI i machine learningMożliwości machine learning i AI
52Lepsze
31
Efektywność energetycznaPobór mocy w różnych obciążeniach
64
82Lepsze
Ocena Head to HeadOgólna ocena katalogu
69Lepsze
58
PEŁNE PORÓWNANIE
Specyfikacja
The better numeric value is highlighted in green, taking the metric direction into account.
Sekcja «Specyfikacja» porównuje RTX 3080 Ti i RX 5500 na podstawie znormalizowanych danych H2H i zamienia specyfikacje, testy oraz opłacalność w praktyczny kontekst wyboru.
DisplayPortDisplayPort 1.4aDisplayPort 1.4
HDMIHDMI 2.1HDMI 2.0b
Device classDesktopDesktop
UpscalingDLSS 2FSR
Maks. liczba monitorów4Varies by board
Maks. rozdzielczość7680 × 43207680 × 4320
USB Type-CNieNie
DirectX12.212.1
Vulkan1.41.4
Pobór mocy350 W150 WLepsze
OpenGL4.64.6
TFLOPS34.1Lepsze5.196
Typ pamięciGDDR6XGDDR6
Złącze zasilania8+8 pin8 pin
Data premiery20212019
ArchitekturaAmpereRDNA 1.0
GrubośćDual-slotVaries by board
API obliczenioweOpenCL 3.0, CUDA 8.6OpenCL 2.1
Cena premierowa$1199$229Lepsze
Jednostki shader / rdzenie10240Lepsze1408
Taktowanie1365 - 1665 MHz1500 - 1845 MHzLepsze
Taktowanie bazowe1365 MHz1500 MHzLepsze
Taktowanie boost1665 MHz1845 MHzLepsze
Pamięć wideo12 GB GDDR6XLepsze4 GB GDDR6
Taktowanie pamięci19 GHzLepsze14 GHz
Magistrala pamięci384 bitLepsze128 bit
Przepustowość pamięci912 GB/sLepsze224 GB/s
InterfejsPCIe 4x16PCIe 4x8
Pobór mocy350 W150 WLepsze
Proces technologiczny8 nm7 nmLepsze
Zalecany zasilacz750 WVaries by board
Długość285 mmVaries by board
Rozmiar rdzenia628 mm²158 mm²Lepsze
Cache pamięciL1 128 KB, L2 6 MBL2 2 MBLepsze
Liczba tranzystorów28300 millionLepsze6400 million
GAME TEST BENCH
FPS w grach
Available results are shown separately; missing data is not treated as zero.
Sekcja FPS w grach porównuje RTX 3080 Ti i RX 5500 w wybranych presetach H2H Lab. Ważny jest nie tylko średni FPS: liczy się zachowanie w 1440p i 4K, wpływ pamięci oraz magistrali na ciężkie tekstury, stabilność 1% low i to, czy silnik gry premiuje raster, ray tracing czy dojrzałość sterowników.
RTX 3080 TiRX 5500
Zweryfikowane H2HZweryfikowane przez społecznośćSzacowanePrognozowane
Black Myth: Wukong
1080p High
33 FPSSzacowane 66%
22 FPSSzacowane 66%
1080p Ultra
28 FPSSzacowane 66%
19 FPSSzacowane 66%
1440p Ultra
21 FPSSzacowane 66%
11 FPSSzacowane 61%
4K Ultra
12 FPSSzacowane 66%
5 FPSSzacowane 55%
Black Myth: WukongRTX 3080 Ti33 FPSSzacowane 66%RX 550022 FPSSzacowane 66%RTX 3080 Ti28 FPSSzacowane 66%RX 550019 FPSSzacowane 66%RTX 3080 Ti21 FPSSzacowane 66%RX 550011 FPSSzacowane 61%RTX 3080 Ti12 FPSSzacowane 66%RX 55005 FPSSzacowane 55%
Call of Duty: WarzoneRTX 3080 Ti33 FPSSzacowane 66%RX 550022 FPSSzacowane 66%RTX 3080 Ti28 FPSSzacowane 66%RX 550019 FPSSzacowane 66%RTX 3080 Ti21 FPSSzacowane 66%RX 550011 FPSSzacowane 61%RTX 3080 Ti12 FPSSzacowane 66%RX 55005 FPSSzacowane 55%
Counter-Strike 2RTX 3080 Ti276 FPSSzacowane 74%RX 5500189 FPSSzacowane 74%RTX 3080 Ti194 FPSSzacowane 74%RX 5500133 FPSSzacowane 74%RTX 3080 Ti151 FPSSzacowane 74%RX 550077 FPSSzacowane 69%RTX 3080 Ti75 FPSSzacowane 74%RX 550023 FPSSzacowane 62%
Cyberpunk 2077RTX 3080 Ti178 FPSSzacowane 74%RX 5500122 FPSSzacowane 74%RTX 3080 Ti153 FPSSzacowane 74%RX 5500105 FPSSzacowane 74%RTX 3080 Ti109 FPSSzacowane 74%RX 550056 FPSSzacowane 69%RTX 3080 Ti50 FPSSzacowane 74%RX 550015 FPSSzacowane 62%
Forza Horizon 5RTX 3080 Ti225 FPSSzacowane 80%RX 5500154 FPSSzacowane 80%RTX 3080 Ti145 FPSSzacowane 74%RX 550099 FPSSzacowane 74%RTX 3080 Ti136 FPSSzacowane 74%RX 550070 FPSSzacowane 69%RTX 3080 Ti110 FPSSzacowane 74%RX 550034 FPSSzacowane 62%
God of War RagnarökRTX 3080 Ti33 FPSSzacowane 66%RX 550022 FPSSzacowane 66%RTX 3080 Ti28 FPSSzacowane 66%RX 550019 FPSSzacowane 66%RTX 3080 Ti21 FPSSzacowane 66%RX 550011 FPSSzacowane 61%RTX 3080 Ti12 FPSSzacowane 66%RX 55005 FPSSzacowane 55%
Hogwarts LegacyRTX 3080 Ti145 FPSSzacowane 74%RX 550099 FPSSzacowane 74%RTX 3080 Ti122 FPSSzacowane 74%RX 550083 FPSSzacowane 74%RTX 3080 Ti98 FPSSzacowane 74%RX 550050 FPSSzacowane 69%RTX 3080 Ti51 FPSSzacowane 74%RX 550016 FPSSzacowane 62%
Microsoft Flight Simulator 2024RTX 3080 Ti33 FPSSzacowane 66%RX 550022 FPSSzacowane 66%RTX 3080 Ti28 FPSSzacowane 66%RX 550019 FPSSzacowane 66%RTX 3080 Ti21 FPSSzacowane 66%RX 550011 FPSSzacowane 61%RTX 3080 Ti12 FPSSzacowane 66%RX 55005 FPSSzacowane 55%
Monster Hunter WildsRTX 3080 Ti33 FPSSzacowane 66%RX 550022 FPSSzacowane 66%RTX 3080 Ti28 FPSSzacowane 66%RX 550019 FPSSzacowane 66%RTX 3080 Ti21 FPSSzacowane 66%RX 550011 FPSSzacowane 61%RTX 3080 Ti12 FPSSzacowane 66%RX 55005 FPSSzacowane 55%
StarfieldRTX 3080 Ti33 FPSSzacowane 66%RX 550022 FPSSzacowane 66%RTX 3080 Ti28 FPSSzacowane 66%RX 550019 FPSSzacowane 66%RTX 3080 Ti21 FPSSzacowane 66%RX 550011 FPSSzacowane 61%RTX 3080 Ti12 FPSSzacowane 66%RX 55005 FPSSzacowane 55%
HEAD TO HEAD · INDEKS OBLICZONY
Indeksy obciążeń H2H
Porównywalne indeksy wewnętrzne w stałej skali 0–100.
Sekcja «Benchmarki» porównuje RTX 3080 Ti i RX 5500 na podstawie znormalizowanych danych H2H i zamienia specyfikacje, testy oraz opłacalność w praktyczny kontekst wyboru.
H2H Raster IndexH2H Index / 100673758%
H2H Compute IndexH2H Index / 100674441%
H2H Rendering IndexH2H Index / 100714447%
H2H Memory Workload IndexH2H Index / 100806029%
H2H Efficiency IndexH2H Index / 100648225%
Wersjonowane indeksy H2H z normalizowanych danych katalogu; nie są wynikami zewnętrznych benchmarków.
HEAD TO HEAD · INDEKS OBLICZONY
Indeksy obciążeń AI H2H
Profile szacowane na podstawie dostępnej wydajności i pamięci.
Sekcja «Szczegółowe porównanie» porównuje RTX 3080 Ti i RX 5500 na podstawie znormalizowanych danych H2H i zamienia specyfikacje, testy oraz opłacalność w praktyczny kontekst wyboru.
H2H Image Generation IndexH2H Index / 100734841%
H2H ML Training IndexH2H Index / 100724644%
H2H Inference IndexH2H Index / 100714447%
H2H Local LLM IndexH2H Index / 100745039%
H2H Computer Vision IndexH2H Index / 100714447%
Wersjonowane indeksy H2H z normalizowanych danych katalogu; nie są wynikami zewnętrznych benchmarków.
API graficzne, SDK i upscaling
Sekcja «API graficzne, SDK i upscaling» porównuje RTX 3080 Ti i RX 5500 na podstawie znormalizowanych danych H2H i zamienia specyfikacje, testy oraz opłacalność w praktyczny kontekst wyboru.
DirectX12.212.1
Vulkan1.41.4
OpenGL4.64.6
UpscalingDLSS 2FSR
API obliczenioweOpenCL 3.0, CUDA 8.6OpenCL 2.1
Architektura i premiera
Sekcja «Architektura i premiera» porównuje RTX 3080 Ti i RX 5500 na podstawie znormalizowanych danych H2H i zamienia specyfikacje, testy oraz opłacalność w praktyczny kontekst wyboru.
ArchitekturaAmpereRDNA 1.0
Proces technologiczny8 nm7 nmLepsze
Data premiery20212019
Device classDesktopDesktop
Rdzenie GPU, die i taktowania
Sekcja «Rdzenie i taktowania» porównuje RTX 3080 Ti i RX 5500 na podstawie znormalizowanych danych H2H i zamienia specyfikacje, testy oraz opłacalność w praktyczny kontekst wyboru.
Liczba tranzystorów28300 millionLepsze6400 million
Rozmiar rdzenia628 mm²158 mm²Lepsze
Jednostki shader / rdzenie10240Lepsze1408
Taktowanie bazowe1365 MHz1500 MHzLepsze
Taktowanie boost1665 MHz1845 MHzLepsze
Rozmiar płytki, zasilanie i zgodność
Sekcja «Format i zgodność» porównuje RTX 3080 Ti i RX 5500 na podstawie znormalizowanych danych H2H i zamienia specyfikacje, testy oraz opłacalność w praktyczny kontekst wyboru.
InterfejsPCIe 4x16PCIe 4x8
Długość285 mmVaries by board
GrubośćDual-slotVaries by board
Zalecany zasilacz750 WVaries by board
Złącze zasilania8+8 pin8 pin
Wyjścia obrazu i limity
Sekcja «Wyjścia wideo» porównuje RTX 3080 Ti i RX 5500 na podstawie znormalizowanych danych H2H i zamienia specyfikacje, testy oraz opłacalność w praktyczny kontekst wyboru.
HDMIHDMI 2.1HDMI 2.0b
DisplayPortDisplayPort 1.4aDisplayPort 1.4
USB Type-CNieNie
Maks. liczba monitorów4Varies by board
Maks. rozdzielczość7680 × 43207680 × 4320
Pamięć i przepustowość obliczeń
Sekcja «VRAM i przepustowość» porównuje RTX 3080 Ti i RX 5500 na podstawie znormalizowanych danych H2H i zamienia specyfikacje, testy oraz opłacalność w praktyczny kontekst wyboru.
Pamięć wideo12 GB GDDR6XLepsze4 GB GDDR6
Typ pamięciGDDR6XGDDR6
Magistrala pamięci384 bitLepsze128 bit
TFLOPS34.1Lepsze5.196
HEAD TO HEAD · ODKRYJ
6Inne porównania
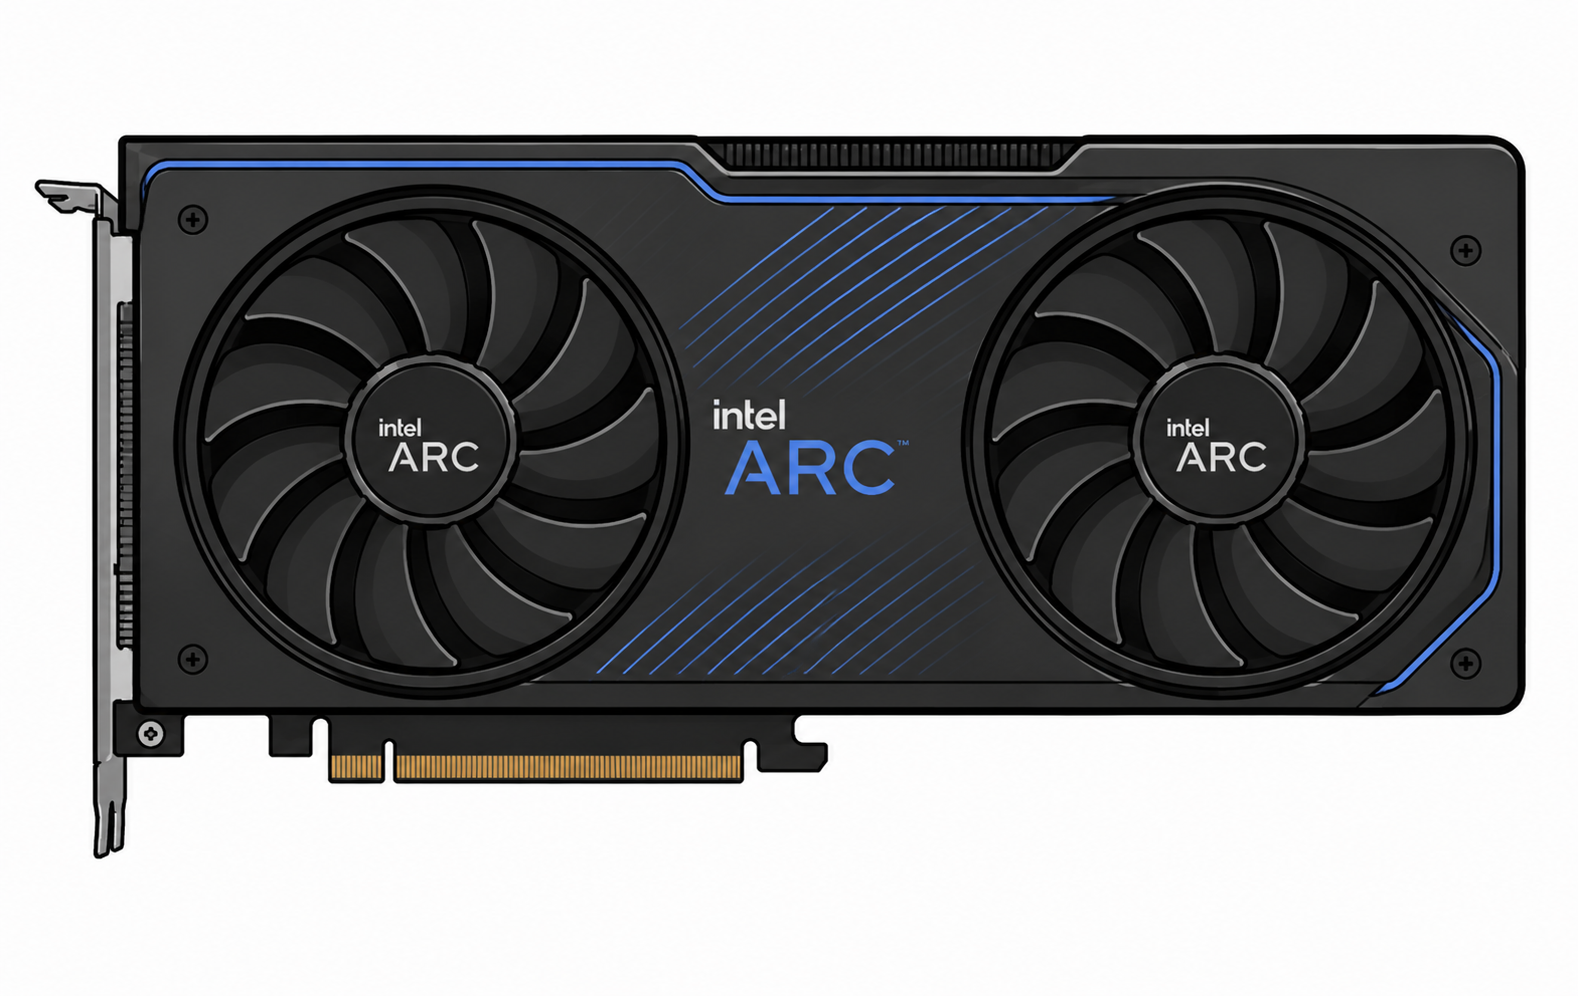 Arc A310Intel
Reviews and questions
WYJAŚNIENIE AI · HEAD TO HEAD
Wyjaśnij to porównanie
Nie tylko procenty: przyczyny, istotne specyfikacje i praktyczny wpływ każdego wykresu.
Co wyjaśni AI
Wynik ogólny, radar, FPS, testy syntetyczne, specyfikacje, efektywność i opłacalność.
PRAWDZIWE KONFIGURACJE
Doświadczenia właścicieli
Prawdziwe zestawy, wyniki i opinie społeczności.
♢Sprawdzone przez moderatora☆Pomocne dla społeczności🏅Odznaki eksperta
Najczęstsze pytania o porównanie
Short recommendations based on performance, memory, power consumption, and intended use.
01Which is better for gaming: RTX 3080 Ti or RX 5500?+
RTX 3080 Ti has the higher overall gaming score, while RX 5500 offers the better price-to-performance ratio. The final choice depends on resolution and settings.
02Which is better for streaming?+
RTX 3080 Ti is the stronger streaming choice thanks to performance, hardware encoding, and application support. Check AV1, H.264, and HEVC support before buying.
03Which is better for Blender?+
RTX 3080 Ti is generally the better option for Blender and GPU rendering. Rendering-engine support and available VRAM also matter.
04Which is better for video editing?+
RTX 3080 Ti offers more overall performance, while RTX 3080 Ti offers more memory headroom. Codecs, hardware encoders, and editor optimization can change the result.
05Which is better for neural networks and AI?+
RTX 3080 Ti is the more practical option for local AI workloads. VRAM capacity, compute libraries, and framework compatibility are especially important.
06Which is better for 1080p?+
RX 5500 is the most rational 1080p choice, where high frame rates and cost per frame matter most.
07Which is better for 1440p?+
RTX 3080 Ti leads in combined 1440p performance. RTX 3080 Ti can be preferable for heavy textures and games with high VRAM usage.
08Which is better for 4K?+
RTX 3080 Ti is preferable for 4K, where total performance, memory bandwidth, and VRAM capacity have the greatest impact.
09Which is better for a quiet PC?+
RX 5500 is easier to use in a quiet build because of its lower estimated power and thermal load. Actual noise depends on the specific cooler.
10Which is better without replacing the power supply?+
RX 5500 is the safer candidate because its stated power consumption is lower. Verify PSU wattage, age, and power connectors.
11Is it worth upgrading from the previous generation?+
Consider upgrading to RTX 3080 Ti if your current device no longer delivers the required FPS, memory capacity, or feature support. A gain below 15–20% is usually worth waiting for a price cut.