
Intel

Intel Arc A770 vs GeForce 8800 GS
Full comparison of specs, performance and benchmarks
NVIDIA
8800 GS
Aggregate performance score
We've compared Arc A770 and 8800 GS across specs and all relevant benchmarks.
↗Arc A770 outperforms 8800 GS by 28% based on our aggregate benchmark results.+28%
Scores are normalized on the Head to Head scale. Higher is better.Intel Arc A770 vs GeForce 8800 GS: key takeaway
The comparison of Arc A770 and 8800 GS shows a 28% advantage for Arc A770 in gaming performance, while 8800 GS may still be stronger in efficiency and feature set. Use the sections below to check whether that lead comes from real FPS, specifications, efficiency, price or platform features.
SUMMARY PROFILE
Verified-metrics radar
Axes with missing data are hidden; every value uses a fixed scale.
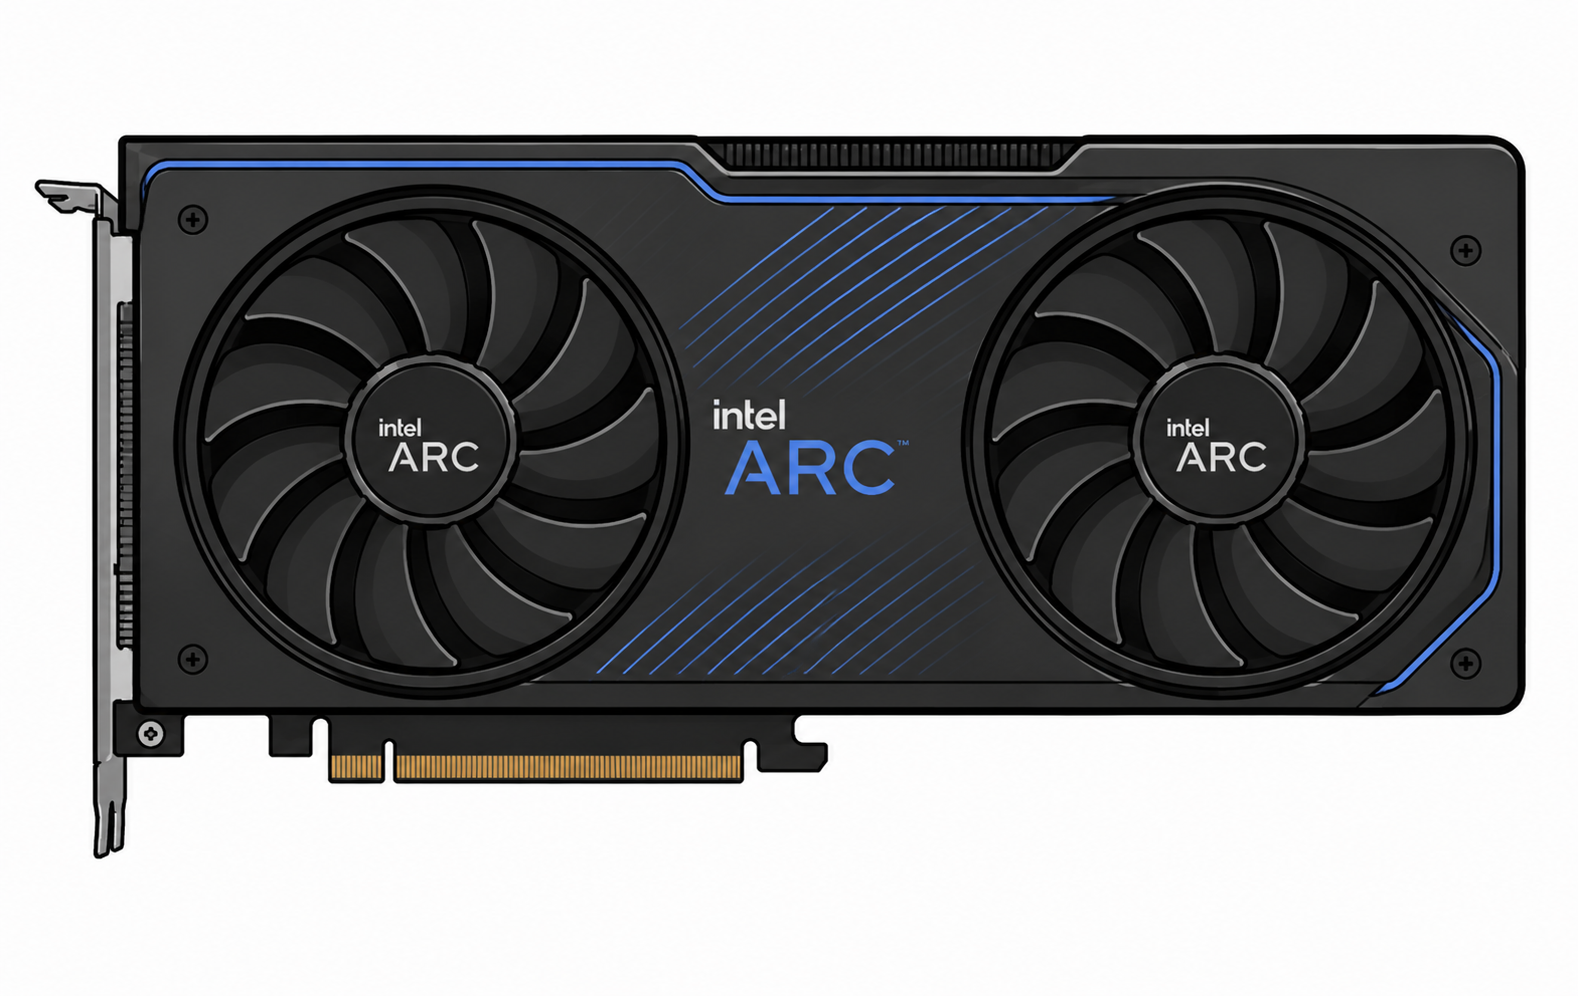 Intel
Intel NVIDIA
Performance
Efficiency
Price / performance
Memory capacity
5543
81100
100100
8817
COMPARISON RESULT
Arc A770 is the best overall choice
Arc A770 leads in combined game performance. Arc A770 offers the better price per frame, while the final choice depends on the required features, memory, and games.
Arc A770 leads in the combined performance index
8800 GS costs less
CATALOG POSITION
Full ranking →Graphics card ranking
Positions 33–38of 317
COMPARISON VERDICT
Which should you choose?
Two practical conclusions based on community votes and gaming value.
GeForce 8800 GS
141 likesHead to Head visitors currently choose this model more often.
GeForce 8800 GS
100/100 · Price $79The choice is based on the price-to-performance index and launch price.
OVERALL SCORE
Overview
Scores are calculated from specifications, performance, and efficiency.
The Summary score section compares Arc A770 and 8800 GS with normalized H2H data, turning specifications, tests and value signals into practical buying context.
GamesDirectX, OpenCL, and Vulkan performance
55Better
43
Professional applications3D modeling, video editing, and rendering
46Better
37
AI and machine learningMachine-learning and AI capabilities
44Better
35
Power efficiencyPower consumption across workloads
81
100Better
Head to Head scoreOverall catalog score
69Better
65
FULL COMPARISON
Specifications
The better numeric value is highlighted in green, taking the metric direction into account.
The Specifications section compares Arc A770 and 8800 GS with normalized H2H data, turning specifications, tests and value signals into practical buying context.
DisplayPortDisplayPort 2.0—
HDMIHDMI 2.1—
Device classDesktopDesktop
DirectX12.210.0
Vulkan1.4—
OpenGL4.63.3
TFLOPS19.66Better0.264
Power consumption225 W105 WBetter
Memory typeGDDR6GDDR3
Power connector8+8 pin6 pin
Memory cacheL2 16 MBL2 0.05 MB
UpscalingXeSS—
Clock speed2100 - 2400 MHzBetter550 MHz
Base clock2100 MHzBetter550 MHz
Boost clock2400 MHzBetter550 MHz
VRAM16 GB GDDR6768 MB GDDR3Better
Memory frequency16 GHzBetter1,9 GHz
Memory bus256 bitBetter192 bit
Memory bandwidth512 GB/sBetter46 GB/s
InterfacePCIe 4x16PCIe 2x16
Release date20222008
ArchitectureXe-HPGTesla
ThicknessDual-slotSingle-slot
Compute APIOpenCL 3.0OpenCL 1.1, CUDA 1.1
Launch price$329$79Better
Shader units / cores4096Better96
Power consumption225 W105 WBetter
Process node6 nmBetter65 nm
Recommended PSU550 W300 WBetter
Die size406 mm²324 mm²Better
Transistor count21700 millionBetter754 million
Max monitors43
Max resolution7680 × 43202560 × 1600
LengthVaries by board229 mm
USB Type-CNoNo
GAME TEST BENCH
Gaming FPS
Available results are shown separately; missing data is not treated as zero.
The Gaming FPS section compares Arc A770 and 8800 GS across curated H2H Lab game presets. The useful signal is not only average FPS, but also how each device behaves at 1440p and 4K, how memory capacity and bus width affect heavy textures, and whether the game engine favors raster performance, ray tracing, or driver maturity.
Arc A7708800 GS
Verified H2HCommunity VerifiedEstimatedPredicted

Black Myth: Wukong
1080p High
27 FPSEstimated 66%
26 FPSEstimated 64%
1080p Ultra
23 FPSEstimated 66%
22 FPSEstimated 64%
1440p Ultra
17 FPSEstimated 66%
12 FPSEstimated 58%
4K Ultra
10 FPSEstimated 66%
5 FPSEstimated 55%
Black Myth: WukongArc A77027 FPSEstimated 66%8800 GS26 FPSEstimated 64%Arc A77023 FPSEstimated 66%8800 GS22 FPSEstimated 64%Arc A77017 FPSEstimated 66%8800 GS12 FPSEstimated 58%Arc A77010 FPSEstimated 66%8800 GS5 FPSEstimated 55%
Call of Duty: WarzoneArc A77027 FPSEstimated 66%8800 GS26 FPSEstimated 64%Arc A77023 FPSEstimated 66%8800 GS22 FPSEstimated 64%Arc A77017 FPSEstimated 66%8800 GS12 FPSEstimated 58%Arc A77010 FPSEstimated 66%8800 GS5 FPSEstimated 55%
Counter-Strike 2Arc A770228 FPSEstimated 74%8800 GS216 FPSEstimated 72%Arc A770160 FPSEstimated 74%8800 GS152 FPSEstimated 72%Arc A770125 FPSEstimated 74%8800 GS85 FPSEstimated 66%Arc A77062 FPSEstimated 74%8800 GS31 FPSEstimated 62%
Cyberpunk 2077Arc A770147 FPSEstimated 74%8800 GS140 FPSEstimated 72%Arc A770127 FPSEstimated 74%8800 GS120 FPSEstimated 72%Arc A77090 FPSEstimated 74%8800 GS62 FPSEstimated 66%Arc A77042 FPSEstimated 74%8800 GS21 FPSEstimated 62%
Forza Horizon 5Arc A770186 FPSEstimated 80%8800 GS176 FPSEstimated 78%Arc A770120 FPSEstimated 74%8800 GS114 FPSEstimated 72%Arc A770112 FPSEstimated 74%8800 GS77 FPSEstimated 66%Arc A77091 FPSEstimated 74%8800 GS45 FPSEstimated 62%
God of War RagnarökArc A77027 FPSEstimated 66%8800 GS26 FPSEstimated 64%Arc A77023 FPSEstimated 66%8800 GS22 FPSEstimated 64%Arc A77017 FPSEstimated 66%8800 GS12 FPSEstimated 58%Arc A77010 FPSEstimated 66%8800 GS5 FPSEstimated 55%
Hogwarts LegacyArc A770120 FPSEstimated 74%8800 GS114 FPSEstimated 72%Arc A770101 FPSEstimated 74%8800 GS95 FPSEstimated 72%Arc A77081 FPSEstimated 74%8800 GS55 FPSEstimated 66%Arc A77042 FPSEstimated 74%8800 GS21 FPSEstimated 62%
Microsoft Flight Simulator 2024Arc A77027 FPSEstimated 66%8800 GS26 FPSEstimated 64%Arc A77023 FPSEstimated 66%8800 GS22 FPSEstimated 64%Arc A77017 FPSEstimated 66%8800 GS12 FPSEstimated 58%Arc A77010 FPSEstimated 66%8800 GS5 FPSEstimated 55%
Monster Hunter WildsArc A77027 FPSEstimated 66%8800 GS26 FPSEstimated 64%Arc A77023 FPSEstimated 66%8800 GS22 FPSEstimated 64%Arc A77017 FPSEstimated 66%8800 GS12 FPSEstimated 58%Arc A77010 FPSEstimated 66%8800 GS5 FPSEstimated 55%
StarfieldArc A77027 FPSEstimated 66%8800 GS26 FPSEstimated 64%Arc A77023 FPSEstimated 66%8800 GS22 FPSEstimated 64%Arc A77017 FPSEstimated 66%8800 GS12 FPSEstimated 58%Arc A77010 FPSEstimated 66%8800 GS5 FPSEstimated 55%
HEAD TO HEAD · CALCULATED INDEX
H2H workload indices
Comparable internal indices on a fixed 0–100 scale.
The Benchmarks section compares Arc A770 and 8800 GS with normalized H2H data, turning specifications, tests and value signals into practical buying context.
H2H Raster IndexH2H Index / 100554324%
H2H Compute IndexH2H Index / 100643559%
H2H Rendering IndexH2H Index / 100643656%
H2H Memory Workload IndexH2H Index / 1008817135%
H2H Efficiency IndexH2H Index / 1008110021%
These are versioned H2H calculated indices derived from normalized catalog data. They are not results from a third-party benchmark.
HEAD TO HEAD · CALCULATED INDEX
H2H AI workload indices
Estimated workload profiles based on available performance and memory data.
The Detailed comparison section compares Arc A770 and 8800 GS with normalized H2H data, turning specifications, tests and value signals into practical buying context.
H2H Image Generation IndexH2H Index / 100703177%
H2H ML Training IndexH2H Index / 100683369%
H2H Inference IndexH2H Index / 100643656%
H2H Local LLM IndexH2H Index / 100732986%
H2H Computer Vision IndexH2H Index / 100653560%
These are versioned H2H calculated indices derived from normalized catalog data. They are not results from a third-party benchmark.
Graphics APIs, SDKs and upscaling
The Graphics APIs, SDKs and upscaling section compares Arc A770 and 8800 GS with normalized H2H data, turning specifications, tests and value signals into practical buying context.
DirectX12.210.0
Vulkan1.4—
OpenGL4.63.3
UpscalingXeSS—
Compute APIOpenCL 3.0OpenCL 1.1, CUDA 1.1
Architecture and release
The Architecture and release section compares Arc A770 and 8800 GS with normalized H2H data, turning specifications, tests and value signals into practical buying context.
ArchitectureXe-HPGTesla
Process node6 nmBetter65 nm
Release date20222008
Device classDesktopDesktop
GPU cores, die and clocks
The Core layout and clocks section compares Arc A770 and 8800 GS with normalized H2H data, turning specifications, tests and value signals into practical buying context.
Transistor count21700 millionBetter754 million
Die size406 mm²324 mm²Better
Shader units / cores4096Better96
Base clock2100 MHzBetter550 MHz
Boost clock2400 MHzBetter550 MHz
Board size, power and compatibility
The Form factor and compatibility section compares Arc A770 and 8800 GS with normalized H2H data, turning specifications, tests and value signals into practical buying context.
InterfacePCIe 4x16PCIe 2x16
LengthVaries by board229 mm
ThicknessDual-slotSingle-slot
Recommended PSU550 W300 WBetter
Power connector8+8 pin6 pin
Display outputs and limits
The Display outputs section compares Arc A770 and 8800 GS with normalized H2H data, turning specifications, tests and value signals into practical buying context.
HDMIHDMI 2.1—
DisplayPortDisplayPort 2.0—
USB Type-CNoNo
Max monitors43
Max resolution7680 × 43202560 × 1600
Memory and compute throughput
The VRAM capacity and bandwidth section compares Arc A770 and 8800 GS with normalized H2H data, turning specifications, tests and value signals into practical buying context.
VRAM16 GB GDDR6768 MB GDDR3Better
Memory typeGDDR6GDDR3
Memory bus256 bitBetter192 bit
TFLOPS19.66Better0.264
HEAD TO HEAD · DISCOVER
6Other comparisons
 Navi II 2CU 7xxx/9xxxAMD
Reviews and questions
AI EXPLAIN · HEAD TO HEAD
Explain this comparison
Beyond percentages: causes, relevant specifications, and practical impact behind every chart.
What AI will explain
Overall score, radar, FPS, synthetic tests, specifications, efficiency, and value.
REAL CONFIGURATIONS
Owner experiences
Real builds, results, and community feedback.
♢Moderator reviewed☆Helpful to the community🏅Expert badges
Frequently asked comparison questions
Short recommendations based on performance, memory, power consumption, and intended use.
01Which is better for gaming: Arc A770 or 8800 GS?+
Arc A770 has the higher overall gaming score, while Arc A770 offers the better price-to-performance ratio. The final choice depends on resolution and settings.
02Which is better for streaming?+
8800 GS is the stronger streaming choice thanks to performance, hardware encoding, and application support. Check AV1, H.264, and HEVC support before buying.
03Which is better for Blender?+
8800 GS is generally the better option for Blender and GPU rendering. Rendering-engine support and available VRAM also matter.
04Which is better for video editing?+
Arc A770 offers more overall performance, while Arc A770 offers more memory headroom. Codecs, hardware encoders, and editor optimization can change the result.
05Which is better for neural networks and AI?+
8800 GS is the more practical option for local AI workloads. VRAM capacity, compute libraries, and framework compatibility are especially important.
06Which is better for 1080p?+
Arc A770 is the most rational 1080p choice, where high frame rates and cost per frame matter most.
07Which is better for 1440p?+
Arc A770 leads in combined 1440p performance. Arc A770 can be preferable for heavy textures and games with high VRAM usage.
08Which is better for 4K?+
Arc A770 is preferable for 4K, where total performance, memory bandwidth, and VRAM capacity have the greatest impact.
09Which is better for a quiet PC?+
8800 GS is easier to use in a quiet build because of its lower estimated power and thermal load. Actual noise depends on the specific cooler.
10Which is better without replacing the power supply?+
8800 GS is the safer candidate because its stated power consumption is lower. Verify PSU wattage, age, and power connectors.
11Is it worth upgrading from the previous generation?+
Consider upgrading to Arc A770 if your current device no longer delivers the required FPS, memory capacity, or feature support. A gain below 15–20% is usually worth waiting for a price cut.