
AMD

Radeon RX 7900 GRE vs GeForce RTX 3090
Özellikler, performans ve benchmarkların tam karşılaştırması
NVIDIA
RTX 3090
Birleşik performans puanı
RX 7900 GRE ve RTX 3090 özellikler ve ilgili testlere göre karşılaştırıldı.
↗RX 7900 GRE, Head to Head birleşik indeksinde RTX 3090 modelinden %3 daha önde.+3%
Puanlar Head to Head ölçeğine göre normalleştirilir. Daha yüksek daha iyidir.Radeon RX 7900 GRE vs GeForce RTX 3090: ana sonuç
RX 7900 GRE ve RTX 3090 karşılaştırması, RX 7900 GRE için «oyun performansı» alanında 3% avantaj gösteriyor; ancak RTX 3090 «verimlilik ve özellik seti» tarafında daha iyi olabilir. Aşağıda farkın FPS, özellik, verimlilik, fiyat veya platformdan gelip gelmediğini kontrol edin.
ÖZET PROFİL
Doğrulanmış metrik radarı
Verisi eksik eksenler gizlenir; her değer sabit ölçek kullanır.
Performans
Verimlilik
Fiyat / performans
Bellek kapasitesi
7068
9065
9974
88100
KARŞILAŞTIRMA SONUCU
RX 7900 GRE genel olarak en iyi seçim
RX 7900 GRE birleşik oyun performansında önde. RX 7900 GRE kare başına daha iyi fiyat sunar; son seçim özelliklere, belleğe ve oyunlara bağlıdır.
RX 7900 GRE birleşik performans indeksinde önde
RX 7900 GRE daha ucuz
KATALOG KONUMU
Tam sıralama →Ekran kartı sıralaması
Konumlar 3–8/ 317
KARŞILAŞTIRMA KARARI
Hangisini seçmelisiniz?
Topluluk oyları ve oyun değeri temelinde iki pratik sonuç.
GeForce RTX 3090
180 beğeniHead to Head ziyaretçileri şu anda bu modeli daha sık seçiyor.
Radeon RX 7900 GRE
99/100 · Fiyat $549Seçim fiyat-performans endeksi ve çıkış fiyatına dayanır.
GENEL PUAN
Genel bakış
Scores are calculated from specifications, performance, and efficiency.
«Özet skor» bölümü RX 7900 GRE ve RTX 3090 modellerini normalize H2H verileriyle karşılaştırır; özellikleri, testleri ve değer sinyallerini pratik satın alma bağlamına çevirir.
OyunlarDirectX, OpenCL ve Vulkan performansı
70Daha iyi
68
Profesyonel uygulamalar3D modelleme, video düzenleme ve render
57Daha iyi
55
AI ve machine learningMachine learning ve AI yetenekleri
54Daha iyi
53
Enerji verimliliğiFarklı yüklerde güç tüketimi
90Daha iyi
65
Head to Head puanıGenel katalog puanı
79Daha iyi
69
TAM KARŞILAŞTIRMA
Özellikler
The better numeric value is highlighted in green, taking the metric direction into account.
«Teknik özellikler» bölümü RX 7900 GRE ve RTX 3090 modellerini normalize H2H verileriyle karşılaştırır; özellikleri, testleri ve değer sinyallerini pratik satın alma bağlamına çevirir.
DisplayPortDisplayPort 2.1DisplayPort 1.4a
HDMIHDMI 2.1aHDMI 2.1
Device classDesktopDesktop
UpscalingFSRDLSS 2
Maksimum monitör44
Maksimum çözünürlük7680 × 43207680 × 4320
USB Type-CEvetHayır
DirectX12.212.2
Vulkan1.41.4
OpenGL4.64.6
TFLOPS45.98Daha iyi35.58
Güç tüketimi260 WDaha iyi350 W
Bellek türüGDDR6GDDR6X
Güç konektörü8+8 pin16 pin
Çıkış tarihi20232020
MimariRDNA 3.0Ampere
KalınlıkDual-slotTriple-slot
Compute APIOpenCL 2.2OpenCL 3.0, CUDA 8.6
Çıkış fiyatı$549Daha iyi$1499
Shader birimleri / çekirdekler512010496Daha iyi
Saat hızı1500 - 2245 MHzDaha iyi1395 - 1695 MHz
Temel saat hızı1500 MHzDaha iyi1395 MHz
Boost saat hızı2245 MHzDaha iyi1695 MHz
Video belleği16 GB GDDR624 GB GDDR6XDaha iyi
Bellek frekansı18 GHz19,5 GHzDaha iyi
Bellek veri yolu256 bit384 bitDaha iyi
Bellek bant genişliği576 GB/s936 GB/sDaha iyi
ArayüzPCIe 4x16PCIe 4x16
Güç tüketimi260 WDaha iyi350 W
Üretim süreci5 nmDaha iyi8 nm
Önerilen PSU600 WDaha iyi750 W
Uzunluk276 mmDaha iyi336 mm
Zar boyutu529 mm²Daha iyi628 mm²
Bellek önbelleğiL1 250 KB, L2 6 MBL1 128 KB, L2 6 MB
Transistör sayısı57700 millionDaha iyi28300 million
GAME TEST BENCH
Oyun FPS
Available results are shown separately; missing data is not treated as zero.
Oyun FPS bölümü RX 7900 GRE ve RTX 3090 modellerini seçilmiş H2H Lab presetlerinde karşılaştırır. Yararlı sinyal yalnızca ortalama FPS değildir: 1440p ve 4K davranışı, bellek kapasitesi ve veri yolu genişliğinin ağır dokulara etkisi, 1% low kararlılığı ve oyun motorunun raster, ray tracing veya sürücü olgunluğunu tercih edip etmediği de önemlidir.
RX 7900 GRERTX 3090
H2H doğrulandıTopluluk doğruladıTahminiÖngörülen

Black Myth: Wukong
1080p High
34 FPSTahmini 66%
33 FPSTahmini 66%
1080p Ultra
29 FPSTahmini 66%
28 FPSTahmini 66%
1440p Ultra
22 FPSTahmini 66%
21 FPSTahmini 66%
4K Ultra
13 FPSTahmini 66%
12 FPSTahmini 66%
Black Myth: WukongRX 7900 GRE34 FPSTahmini 66%RTX 309033 FPSTahmini 66%RX 7900 GRE29 FPSTahmini 66%RTX 309028 FPSTahmini 66%RX 7900 GRE22 FPSTahmini 66%RTX 309021 FPSTahmini 66%RX 7900 GRE13 FPSTahmini 66%RTX 309012 FPSTahmini 66%
Call of Duty: WarzoneRX 7900 GRE34 FPSTahmini 66%RTX 309033 FPSTahmini 66%RX 7900 GRE29 FPSTahmini 66%RTX 309028 FPSTahmini 66%RX 7900 GRE22 FPSTahmini 66%RTX 309021 FPSTahmini 66%RX 7900 GRE13 FPSTahmini 66%RTX 309012 FPSTahmini 66%
Counter-Strike 2RX 7900 GRE289 FPSTahmini 74%RTX 3090281 FPSTahmini 74%RX 7900 GRE203 FPSTahmini 74%RTX 3090197 FPSTahmini 74%RX 7900 GRE158 FPSTahmini 74%RTX 3090153 FPSTahmini 74%RX 7900 GRE79 FPSTahmini 74%RTX 309076 FPSTahmini 74%
Cyberpunk 2077RX 7900 GRE187 FPSTahmini 74%RTX 3090181 FPSTahmini 74%RX 7900 GRE161 FPSTahmini 74%RTX 3090156 FPSTahmini 74%RX 7900 GRE115 FPSTahmini 74%RTX 3090111 FPSTahmini 74%RX 7900 GRE53 FPSTahmini 74%RTX 309051 FPSTahmini 74%
Forza Horizon 5RX 7900 GRE236 FPSTahmini 80%RTX 3090229 FPSTahmini 80%RX 7900 GRE153 FPSTahmini 74%RTX 3090148 FPSTahmini 74%RX 7900 GRE142 FPSTahmini 74%RTX 3090138 FPSTahmini 74%RX 7900 GRE116 FPSTahmini 74%RTX 3090112 FPSTahmini 74%
God of War RagnarökRX 7900 GRE34 FPSTahmini 66%RTX 309033 FPSTahmini 66%RX 7900 GRE29 FPSTahmini 66%RTX 309028 FPSTahmini 66%RX 7900 GRE22 FPSTahmini 66%RTX 309021 FPSTahmini 66%RX 7900 GRE13 FPSTahmini 66%RTX 309012 FPSTahmini 66%
Hogwarts LegacyRX 7900 GRE153 FPSTahmini 74%RTX 3090148 FPSTahmini 74%RX 7900 GRE128 FPSTahmini 74%RTX 3090124 FPSTahmini 74%RX 7900 GRE103 FPSTahmini 74%RTX 3090100 FPSTahmini 74%RX 7900 GRE54 FPSTahmini 74%RTX 309052 FPSTahmini 74%
Microsoft Flight Simulator 2024RX 7900 GRE34 FPSTahmini 66%RTX 309033 FPSTahmini 66%RX 7900 GRE29 FPSTahmini 66%RTX 309028 FPSTahmini 66%RX 7900 GRE22 FPSTahmini 66%RTX 309021 FPSTahmini 66%RX 7900 GRE13 FPSTahmini 66%RTX 309012 FPSTahmini 66%
Monster Hunter WildsRX 7900 GRE34 FPSTahmini 66%RTX 309033 FPSTahmini 66%RX 7900 GRE29 FPSTahmini 66%RTX 309028 FPSTahmini 66%RX 7900 GRE22 FPSTahmini 66%RTX 309021 FPSTahmini 66%RX 7900 GRE13 FPSTahmini 66%RTX 309012 FPSTahmini 66%
StarfieldRX 7900 GRE34 FPSTahmini 66%RTX 309033 FPSTahmini 66%RX 7900 GRE29 FPSTahmini 66%RTX 309028 FPSTahmini 66%RX 7900 GRE22 FPSTahmini 66%RTX 309021 FPSTahmini 66%RX 7900 GRE13 FPSTahmini 66%RTX 309012 FPSTahmini 66%
HEAD TO HEAD · HESAPLANAN İNDEKS
H2H iş yükü indeksleri
Sabit 0–100 ölçekte karşılaştırılabilir iç indeksler.
«Benchmarklar» bölümü RX 7900 GRE ve RTX 3090 modellerini normalize H2H verileriyle karşılaştırır; özellikleri, testleri ve değer sinyallerini pratik satın alma bağlamına çevirir.
H2H Raster IndexH2H Index / 10070683%
H2H Compute IndexH2H Index / 10073713%
H2H Rendering IndexH2H Index / 10075773%
H2H Memory Workload IndexH2H Index / 1008810013%
H2H Efficiency IndexH2H Index / 100906532%
Normalleştirilmiş katalog verilerinden türetilen H2H indeksleridir; harici benchmark sonucu değildir.
HEAD TO HEAD · HESAPLANAN İNDEKS
H2H AI iş yükü indeksleri
Mevcut performans ve bellek verilerine dayalı tahmini profiller.
«Detaylı karşılaştırma» bölümü RX 7900 GRE ve RTX 3090 modellerini normalize H2H verileriyle karşılaştırır; özellikleri, testleri ve değer sinyallerini pratik satın alma bağlamına çevirir.
H2H Image Generation IndexH2H Index / 10078825%
H2H ML Training IndexH2H Index / 10077815%
H2H Inference IndexH2H Index / 10075773%
H2H Local LLM IndexH2H Index / 10080867%
H2H Computer Vision IndexH2H Index / 10075784%
Normalleştirilmiş katalog verilerinden türetilen H2H indeksleridir; harici benchmark sonucu değildir.
Grafik API’leri, SDK ve upscaling
«Grafik API’leri, SDK ve upscaling» bölümü RX 7900 GRE ve RTX 3090 modellerini normalize H2H verileriyle karşılaştırır; özellikleri, testleri ve değer sinyallerini pratik satın alma bağlamına çevirir.
DirectX12.212.2
Vulkan1.41.4
OpenGL4.64.6
UpscalingFSRDLSS 2
Compute APIOpenCL 2.2OpenCL 3.0, CUDA 8.6
Mimari ve çıkış
«Mimari ve çıkış» bölümü RX 7900 GRE ve RTX 3090 modellerini normalize H2H verileriyle karşılaştırır; özellikleri, testleri ve değer sinyallerini pratik satın alma bağlamına çevirir.
MimariRDNA 3.0Ampere
Üretim süreci5 nmDaha iyi8 nm
Çıkış tarihi20232020
Device classDesktopDesktop
GPU çekirdekleri, die ve saat hızları
«Çekirdekler ve frekanslar» bölümü RX 7900 GRE ve RTX 3090 modellerini normalize H2H verileriyle karşılaştırır; özellikleri, testleri ve değer sinyallerini pratik satın alma bağlamına çevirir.
Transistör sayısı57700 millionDaha iyi28300 million
Zar boyutu529 mm²Daha iyi628 mm²
Shader birimleri / çekirdekler512010496Daha iyi
Temel saat hızı1500 MHzDaha iyi1395 MHz
Boost saat hızı2245 MHzDaha iyi1695 MHz
Kart boyutu, güç ve uyumluluk
«Form faktörü ve uyumluluk» bölümü RX 7900 GRE ve RTX 3090 modellerini normalize H2H verileriyle karşılaştırır; özellikleri, testleri ve değer sinyallerini pratik satın alma bağlamına çevirir.
ArayüzPCIe 4x16PCIe 4x16
Uzunluk276 mmDaha iyi336 mm
KalınlıkDual-slotTriple-slot
Önerilen PSU600 WDaha iyi750 W
Güç konektörü8+8 pin16 pin
Görüntü çıkışları ve sınırlar
«Görüntü çıkışları» bölümü RX 7900 GRE ve RTX 3090 modellerini normalize H2H verileriyle karşılaştırır; özellikleri, testleri ve değer sinyallerini pratik satın alma bağlamına çevirir.
HDMIHDMI 2.1aHDMI 2.1
DisplayPortDisplayPort 2.1DisplayPort 1.4a
USB Type-CEvetHayır
Maksimum monitör44
Maksimum çözünürlük7680 × 43207680 × 4320
Bellek ve hesaplama bant genişliği
«VRAM ve bant genişliği» bölümü RX 7900 GRE ve RTX 3090 modellerini normalize H2H verileriyle karşılaştırır; özellikleri, testleri ve değer sinyallerini pratik satın alma bağlamına çevirir.
Video belleği16 GB GDDR624 GB GDDR6XDaha iyi
Bellek türüGDDR6GDDR6X
Bellek veri yolu256 bit384 bitDaha iyi
TFLOPS45.98Daha iyi35.58
HEAD TO HEAD · KEŞFET
6Diğer karşılaştırmalar
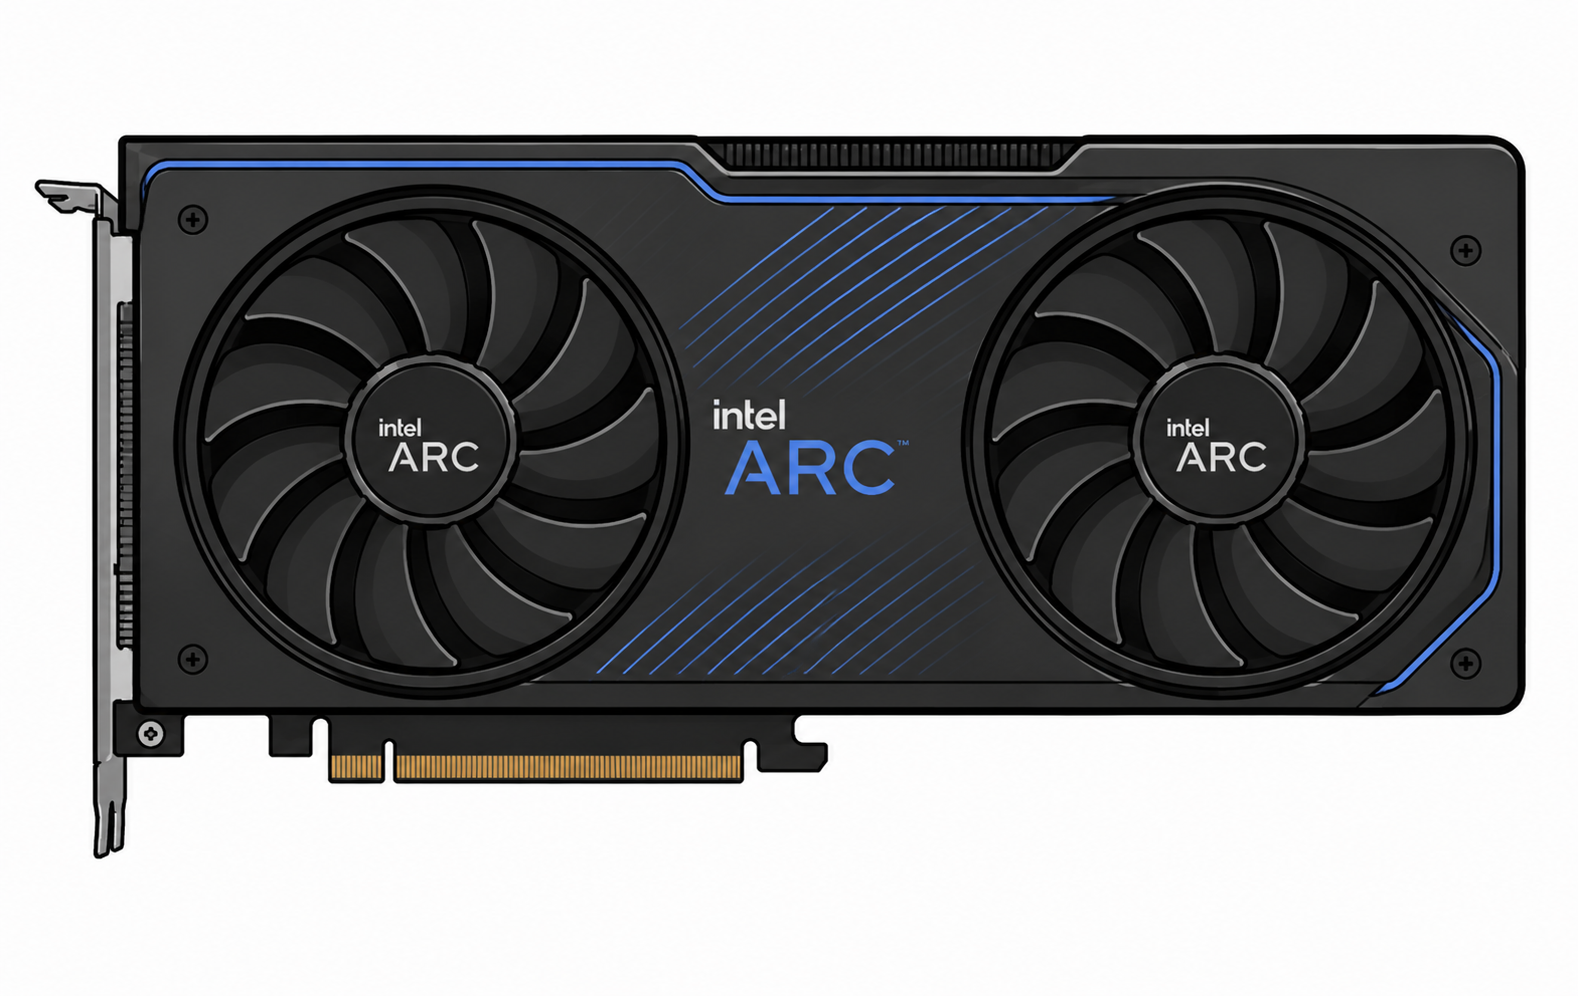 Arc A310IntelVS
 GTX 1050 3GBNVIDIAKarşılaştırmayı aç →Arc A310IntelVSGTX 1630NVIDIAKarşılaştırmayı aç →Arc A310IntelVSGTX 1650NVIDIAKarşılaştırmayı aç →Arc A310IntelVS
 Navi II 2CU 7xxx/9xxxAMDKarşılaştırmayı aç →Arc A310IntelVSRX 5500AMDKarşılaştırmayı aç →Arc A310IntelVSRX 6400AMDKarşılaştırmayı aç →
Reviews and questions
AI AÇIKLAMA · HEAD TO HEAD
Bu karşılaştırmayı açıkla
Yüzdelerin ötesinde: her grafiğin arkasındaki nedenler, ilgili özellikler ve pratik etki.
AI neyi açıklayacak
Genel skor, radar, FPS, sentetik testler, özellikler, verimlilik ve değer.
GERÇEK SİSTEMLER
Kullanıcı deneyimleri
Gerçek sistemler, sonuçlar ve topluluk geri bildirimi.
♢Moderatör tarafından incelendi☆Topluluğa faydalı🏅Uzman rozetleri
Karşılaştırma hakkında sık sorulanlar
Short recommendations based on performance, memory, power consumption, and intended use.
01Which is better for gaming: RX 7900 GRE or RTX 3090?+
RX 7900 GRE has the higher overall gaming score, while RX 7900 GRE offers the better price-to-performance ratio. The final choice depends on resolution and settings.
02Which is better for streaming?+
RTX 3090 is the stronger streaming choice thanks to performance, hardware encoding, and application support. Check AV1, H.264, and HEVC support before buying.
03Which is better for Blender?+
RTX 3090 is generally the better option for Blender and GPU rendering. Rendering-engine support and available VRAM also matter.
04Which is better for video editing?+
RX 7900 GRE offers more overall performance, while RX 7900 GRE offers more memory headroom. Codecs, hardware encoders, and editor optimization can change the result.
05Which is better for neural networks and AI?+
RTX 3090 is the more practical option for local AI workloads. VRAM capacity, compute libraries, and framework compatibility are especially important.
06Which is better for 1080p?+
RX 7900 GRE is the most rational 1080p choice, where high frame rates and cost per frame matter most.
07Which is better for 1440p?+
RX 7900 GRE leads in combined 1440p performance. RX 7900 GRE can be preferable for heavy textures and games with high VRAM usage.
08Which is better for 4K?+
RX 7900 GRE is preferable for 4K, where total performance, memory bandwidth, and VRAM capacity have the greatest impact.
09Which is better for a quiet PC?+
RX 7900 GRE is easier to use in a quiet build because of its lower estimated power and thermal load. Actual noise depends on the specific cooler.
10Which is better without replacing the power supply?+
RX 7900 GRE is the safer candidate because its stated power consumption is lower. Verify PSU wattage, age, and power connectors.
11Is it worth upgrading from the previous generation?+
Consider upgrading to RX 7900 GRE if your current device no longer delivers the required FPS, memory capacity, or feature support. A gain below 15–20% is usually worth waiting for a price cut.