
AMD

Radeon RX 7900 GRE vs Intel Arc A750
Comparación completa de especificaciones, rendimiento y benchmarks
Intel
Arc A750
Puntuación agregada de rendimiento
Hemos comparado RX 7900 GRE y Arc A750 por especificaciones y pruebas relevantes.
↗RX 7900 GRE supera a Arc A750 por 37% según el índice agregado de Head to Head.+37%
Las puntuaciones están normalizadas en la escala Head to Head. Más alto es mejor.Radeon RX 7900 GRE vs Intel Arc A750: conclusión clave
La comparación entre RX 7900 GRE y Arc A750 muestra una ventaja del 37% para RX 7900 GRE en «rendimiento en juegos», aunque Arc A750 puede ser mejor en «relación calidad-precio». Abajo puedes ver si la diferencia viene de FPS, especificaciones, eficiencia, precio o plataforma.
PERFIL RESUMIDO
Radar de métricas verificadas
Los ejes sin datos se ocultan; cada valor usa una escala fija.
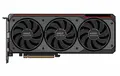 AMD
AMD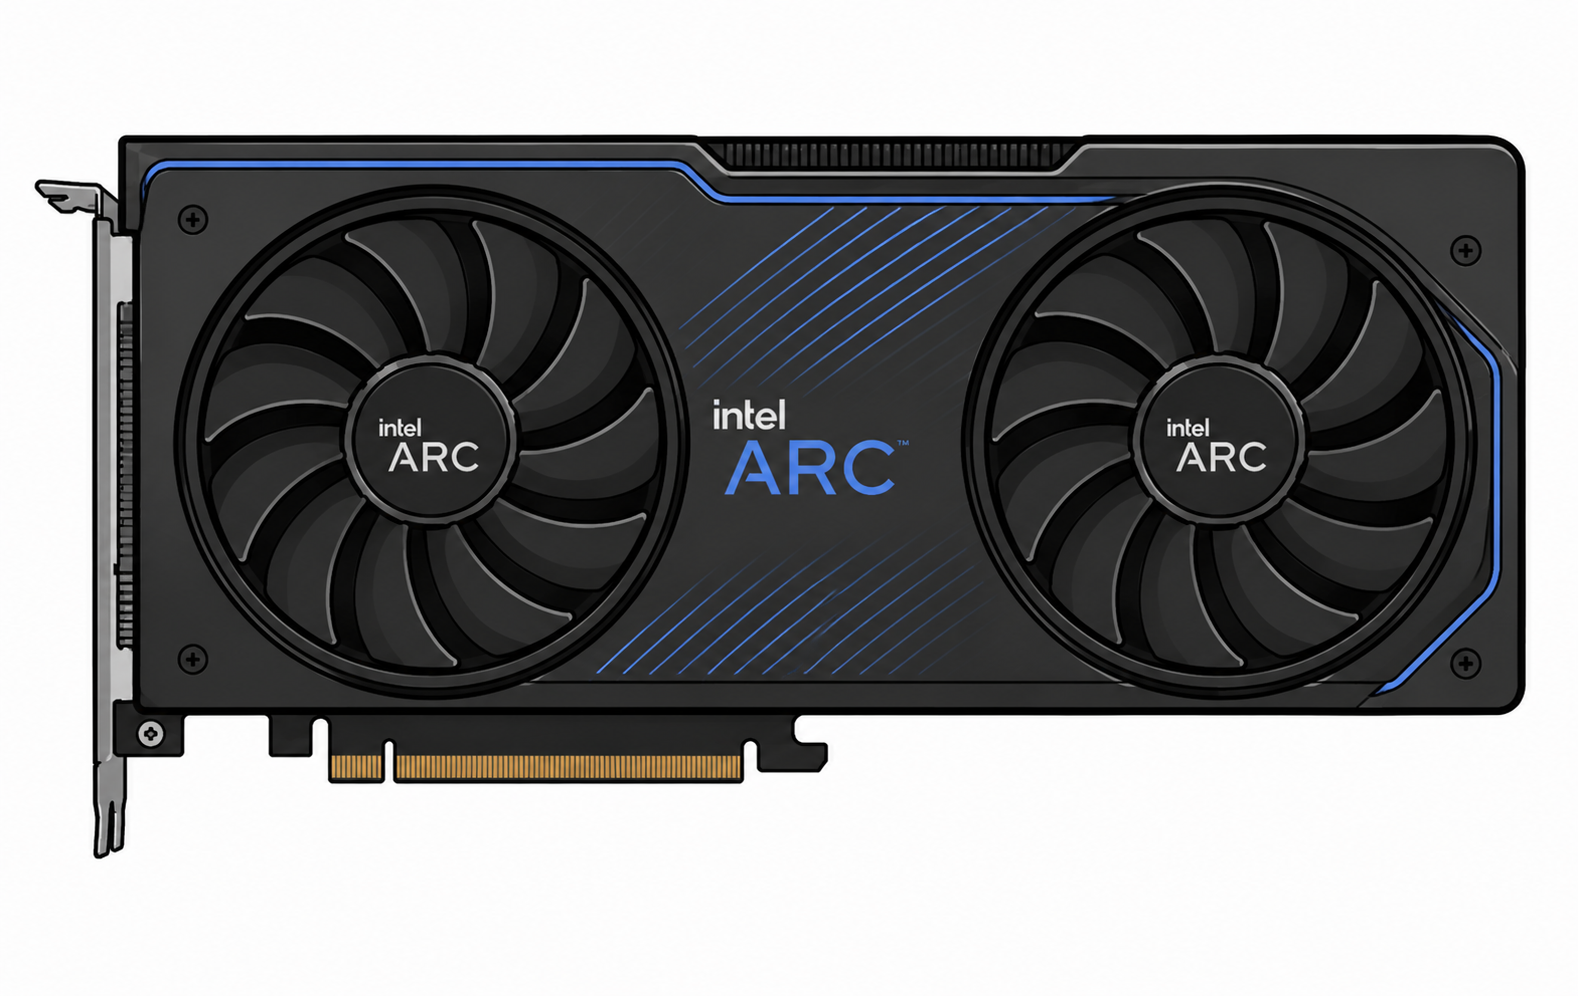 Intel
IntelRendimiento
Eficiencia
Precio / rendimiento
Capacidad de memoria
7051
9076
99100
8868
RESULTADO DE LA COMPARACIÓN
RX 7900 GRE es la mejor opción general
RX 7900 GRE lidera en rendimiento combinado en juegos. Arc A750 ofrece mejor precio por frame; la elección final depende de funciones, memoria y juegos.
RX 7900 GRE lidera en el índice combinado
Arc A750 cuesta menos
POSICIÓN EN EL CATÁLOGO
Ranking completo →Ranking de tarjetas gráficas
Posiciones 3–8de 317
VEREDICTO DE COMPARACIÓN
¿Cuál elegir?
Dos conclusiones prácticas basadas en votos de la comunidad y valor en juegos.
Intel Arc A750
124 Me gustaLos visitantes de Head to Head eligen actualmente este modelo con más frecuencia.
Intel Arc A750
100/100 · Precio $289La elección se basa en el índice precio/rendimiento y el precio de lanzamiento.
PUNTUACIÓN GENERAL
Resumen
Las puntuaciones se calculan a partir de las especificaciones, el rendimiento y la eficiencia.
La sección «Puntuación resumida» compara RX 7900 GRE y Arc A750 con datos H2H normalizados y convierte especificaciones, pruebas y valor en contexto práctico de compra.
JuegosRendimiento de DirectX, OpenCL y Vulkan
70Mejor
51
Aplicaciones profesionalesModelado 3D, edición de vídeo y renderizado.
57Mejor
43
Inteligencia artificial y aprendizaje automáticoCapacidades de aprendizaje automático e inteligencia artificial
54Mejor
41
Eficiencia energéticaConsumo de energía en todas las cargas de trabajo
90Mejor
76
Head to Head puntajePuntuación general del catálogo
79Mejor
65
COMPARACIÓN COMPLETA
Especificaciones
El mejor valor numérico se resalta en verde, teniendo en cuenta la dirección de la métrica.
La sección «Especificaciones» compara RX 7900 GRE y Arc A750 con datos H2H normalizados y convierte especificaciones, pruebas y valor en contexto práctico de compra.
DisplayPortDisplayPort 2.1DisplayPort 2.0
HDMIHDMI 2.1aHDMI 2.1
Device classDesktopDesktop
EscaladoFSRXeSS
Máximo de monitores44
Resolución máxima7680 × 43207680 × 4320
USB Type-CSíNo
DirectX12.212.2
Vulkan1.41.4
OpenGL4.64.6
TFLOPS45.98Mejor17.2
Consumo de energía260 W225 WMejor
Tipo de memoriaGDDR6GDDR6
Conector de alimentación8+8 pin6+8 pin
Fecha de lanzamiento20232022
ArquitecturaRDNA 3.0Xe-HPG
GrosorDual-slotDual-slot
API de cómputoOpenCL 2.2OpenCL 3.0
Precio de lanzamiento$549$289Mejor
Unidades shader / núcleos5120Mejor3584
Frecuencia1500 - 2245 MHz2050 - 2400 MHzMejor
Frecuencia base1500 MHz2050 MHzMejor
Frecuencia boost2245 MHz2400 MHzMejor
Memoria de vídeo16 GB GDDR6Mejor8 GB GDDR6
Frecuencia de memoria18 GHzMejor16 GHz
Bus de memoria256 bit256 bit
Ancho de banda de memoria576 GB/sMejor512 GB/s
InterfazPCIe 4x16PCIe 4x16
Consumo de energía260 W225 WMejor
Proceso de fabricación5 nmMejor6 nm
Fuente recomendada600 W550 WMejor
Longitud276 mmVaries by board
Tamaño del die529 mm²406 mm²Mejor
Caché de memoriaL1 250 KB, L2 6 MBL2 16 MBMejor
Número de transistores57700 millionMejor21700 million
BANCO DE PRUEBAS DE JUEGOS
FPS en juegos
Los resultados disponibles se muestran por separado; los datos faltantes no se tratan como cero.
La sección de FPS en juegos compara RX 7900 GRE y Arc A750 en presets seleccionados de H2H Lab. La señal útil no es solo el FPS medio: también importa el comportamiento en 1440p y 4K, la memoria y el bus con texturas pesadas, la estabilidad del 1% low y si el motor favorece raster, ray tracing o drivers maduros.
RX 7900 GREArc A750
Verificado H2HVerificado por la comunidadEstimadoPredicho

Black Myth: Wukong
1080p High
34 FPSEstimado 66%
26 FPSEstimado 66%
1080p Ultra
29 FPSEstimado 66%
22 FPSEstimado 66%
1440p Ultra
22 FPSEstimado 66%
17 FPSEstimado 66%
4K Ultra
13 FPSEstimado 66%
8 FPSEstimado 61%
Black Myth: WukongRX 7900 GRE34 FPSEstimado 66%Arc A75026 FPSEstimado 66%RX 7900 GRE29 FPSEstimado 66%Arc A75022 FPSEstimado 66%RX 7900 GRE22 FPSEstimado 66%Arc A75017 FPSEstimado 66%RX 7900 GRE13 FPSEstimado 66%Arc A7508 FPSEstimado 61%
Call of Duty: WarzoneRX 7900 GRE34 FPSEstimado 66%Arc A75026 FPSEstimado 66%RX 7900 GRE29 FPSEstimado 66%Arc A75022 FPSEstimado 66%RX 7900 GRE22 FPSEstimado 66%Arc A75017 FPSEstimado 66%RX 7900 GRE13 FPSEstimado 66%Arc A7508 FPSEstimado 61%
Counter-Strike 2RX 7900 GRE289 FPSEstimado 74%Arc A750221 FPSEstimado 74%RX 7900 GRE203 FPSEstimado 74%Arc A750156 FPSEstimado 74%RX 7900 GRE158 FPSEstimado 74%Arc A750121 FPSEstimado 74%RX 7900 GRE79 FPSEstimado 74%Arc A75047 FPSEstimado 69%
Cyberpunk 2077RX 7900 GRE187 FPSEstimado 74%Arc A750143 FPSEstimado 74%RX 7900 GRE161 FPSEstimado 74%Arc A750123 FPSEstimado 74%RX 7900 GRE115 FPSEstimado 74%Arc A75088 FPSEstimado 74%RX 7900 GRE53 FPSEstimado 74%Arc A75032 FPSEstimado 69%
Forza Horizon 5RX 7900 GRE236 FPSEstimado 80%Arc A750180 FPSEstimado 80%RX 7900 GRE153 FPSEstimado 74%Arc A750117 FPSEstimado 74%RX 7900 GRE142 FPSEstimado 74%Arc A750109 FPSEstimado 74%RX 7900 GRE116 FPSEstimado 74%Arc A75069 FPSEstimado 69%
God of War RagnarökRX 7900 GRE34 FPSEstimado 66%Arc A75026 FPSEstimado 66%RX 7900 GRE29 FPSEstimado 66%Arc A75022 FPSEstimado 66%RX 7900 GRE22 FPSEstimado 66%Arc A75017 FPSEstimado 66%RX 7900 GRE13 FPSEstimado 66%Arc A7508 FPSEstimado 61%
Hogwarts LegacyRX 7900 GRE153 FPSEstimado 74%Arc A750117 FPSEstimado 74%RX 7900 GRE128 FPSEstimado 74%Arc A75098 FPSEstimado 74%RX 7900 GRE103 FPSEstimado 74%Arc A75079 FPSEstimado 74%RX 7900 GRE54 FPSEstimado 74%Arc A75032 FPSEstimado 69%
Microsoft Flight Simulator 2024RX 7900 GRE34 FPSEstimado 66%Arc A75026 FPSEstimado 66%RX 7900 GRE29 FPSEstimado 66%Arc A75022 FPSEstimado 66%RX 7900 GRE22 FPSEstimado 66%Arc A75017 FPSEstimado 66%RX 7900 GRE13 FPSEstimado 66%Arc A7508 FPSEstimado 61%
Monster Hunter WildsRX 7900 GRE34 FPSEstimado 66%Arc A75026 FPSEstimado 66%RX 7900 GRE29 FPSEstimado 66%Arc A75022 FPSEstimado 66%RX 7900 GRE22 FPSEstimado 66%Arc A75017 FPSEstimado 66%RX 7900 GRE13 FPSEstimado 66%Arc A7508 FPSEstimado 61%
StarfieldRX 7900 GRE34 FPSEstimado 66%Arc A75026 FPSEstimado 66%RX 7900 GRE29 FPSEstimado 66%Arc A75022 FPSEstimado 66%RX 7900 GRE22 FPSEstimado 66%Arc A75017 FPSEstimado 66%RX 7900 GRE13 FPSEstimado 66%Arc A7508 FPSEstimado 61%
HEAD TO HEAD · ÍNDICE CALCULADO
Índices de carga H2H
Índices internos comparables en escala fija 0–100.
La sección «Benchmarks» compara RX 7900 GRE y Arc A750 con datos H2H normalizados y convierte especificaciones, pruebas y valor en contexto práctico de compra.
H2H Raster IndexH2H Index / 100705131%
H2H Compute IndexH2H Index / 100735823%
H2H Rendering IndexH2H Index / 100755629%
H2H Memory Workload IndexH2H Index / 100886826%
H2H Efficiency IndexH2H Index / 100907617%
Índices H2H versionados desde datos normalizados del catálogo; no son resultados de un benchmark externo.
HEAD TO HEAD · ÍNDICE CALCULADO
Índices de carga de IA H2H
Perfiles estimados según rendimiento y memoria disponibles.
La sección «Comparación detallada» compara RX 7900 GRE y Arc A750 con datos H2H normalizados y convierte especificaciones, pruebas y valor en contexto práctico de compra.
H2H Image Generation IndexH2H Index / 100785928%
H2H ML Training IndexH2H Index / 100775828%
H2H Inference IndexH2H Index / 100755629%
H2H Local LLM IndexH2H Index / 100806029%
H2H Computer Vision IndexH2H Index / 100755629%
Índices H2H versionados desde datos normalizados del catálogo; no son resultados de un benchmark externo.
API gráficas, SDK y escalado
La sección «API gráficas, SDK y escalado» compara RX 7900 GRE y Arc A750 con datos H2H normalizados y convierte especificaciones, pruebas y valor en contexto práctico de compra.
DirectX12.212.2
Vulkan1.41.4
OpenGL4.64.6
EscaladoFSRXeSS
API de cómputoOpenCL 2.2OpenCL 3.0
Arquitectura y lanzamiento
La sección «Arquitectura y lanzamiento» compara RX 7900 GRE y Arc A750 con datos H2H normalizados y convierte especificaciones, pruebas y valor en contexto práctico de compra.
ArquitecturaRDNA 3.0Xe-HPG
Proceso de fabricación5 nmMejor6 nm
Fecha de lanzamiento20232022
Device classDesktopDesktop
Núcleos GPU, die y frecuencias
La sección «Núcleos y frecuencias» compara RX 7900 GRE y Arc A750 con datos H2H normalizados y convierte especificaciones, pruebas y valor en contexto práctico de compra.
Número de transistores57700 millionMejor21700 million
Tamaño del die529 mm²406 mm²Mejor
Unidades shader / núcleos5120Mejor3584
Frecuencia base1500 MHz2050 MHzMejor
Frecuencia boost2245 MHz2400 MHzMejor
Tamaño de placa, energía y compatibilidad
La sección «Formato y compatibilidad» compara RX 7900 GRE y Arc A750 con datos H2H normalizados y convierte especificaciones, pruebas y valor en contexto práctico de compra.
InterfazPCIe 4x16PCIe 4x16
Longitud276 mmVaries by board
GrosorDual-slotDual-slot
Fuente recomendada600 W550 WMejor
Conector de alimentación8+8 pin6+8 pin
Salidas de pantalla y límites
La sección «Salidas de vídeo» compara RX 7900 GRE y Arc A750 con datos H2H normalizados y convierte especificaciones, pruebas y valor en contexto práctico de compra.
HDMIHDMI 2.1aHDMI 2.1
DisplayPortDisplayPort 2.1DisplayPort 2.0
USB Type-CSíNo
Máximo de monitores44
Resolución máxima7680 × 43207680 × 4320
Memoria y rendimiento de cómputo
La sección «VRAM y ancho de banda» compara RX 7900 GRE y Arc A750 con datos H2H normalizados y convierte especificaciones, pruebas y valor en contexto práctico de compra.
Memoria de vídeo16 GB GDDR6Mejor8 GB GDDR6
Tipo de memoriaGDDR6GDDR6
Bus de memoria256 bit256 bit
TFLOPS45.98Mejor17.2
HEAD TO HEAD · DESCUBRIR
6Otras comparaciones
 GTX 1050 3GBNVIDIA
Reviews and questions
EXPLICACIÓN IA · HEAD TO HEAD
Explicar esta comparación
Más allá de porcentajes: causas, especificaciones relevantes e impacto práctico detrás de cada gráfico.
Qué explicará la IA
Puntuación total, radar, FPS, pruebas sintéticas, especificaciones, eficiencia y valor.
CONFIGURACIONES REALES
Experiencias de propietarios
Montajes reales, resultados y comentarios de la comunidad.
♢Revisado por moderador☆Útil para la comunidad🏅Insignias de experto
Preguntas frecuentes sobre la comparación
Recomendaciones breves basadas en el rendimiento, la memoria, el consumo de energía y el uso previsto.
01¿Cuál es mejor para jugar: RX 7900 GRE o Arc A750?+
RX 7900 GRE tiene la puntuación general más alta en juegos, mientras que Arc A750 ofrece una mejor relación precio-rendimiento. La elección final depende de la resolución y la configuración.
02¿Cuál es mejor para la transmisión en directo?+
RX 7900 GRE es la mejor opción para streaming gracias a su rendimiento, codificación por hardware y compatibilidad con aplicaciones. Consulta la compatibilidad con AV1, H.264 y HEVC antes de comprar.
03¿Cuál es mejor para Blender?+
RX 7900 GRE suele ser la mejor opción para Blender y la renderización por GPU. La compatibilidad con el motor de renderizado y la VRAM disponible también son importantes.
04¿Cuál es mejor para la edición de vídeo?+
RX 7900 GRE ofrece un mejor rendimiento general, mientras que RX 7900 GRE ofrece mayor capacidad de memoria. Los códecs, los codificadores de hardware y la optimización del editor pueden modificar el resultado.
05¿Qué es mejor para las redes neuronales y la IA?+
RX 7900 GRE es la opción más práctica para cargas de trabajo de IA locales. La capacidad de VRAM, las bibliotecas de computación y la compatibilidad con el framework son especialmente importantes.
06¿Cuál es mejor para 1080p?+
Arc A750 es la opción más racional en 1080p, donde las altas tasas de fotogramas y el costo por fotograma son lo más importante.
07¿Cuál es mejor para 1440p?+
RX 7900 GRE lidera en rendimiento combinado a 1440p. RX 7900 GRE puede ser preferible para texturas pesadas y juegos con alto consumo de VRAM.
08¿Cuál es mejor para 4K?+
RX 7900 GRE es preferible para 4K, donde el rendimiento total, el ancho de banda de la memoria y la capacidad de VRAM tienen el mayor impacto.
09¿Cuál es mejor para un PC silencioso?+
Este producto es más fácil de usar en configuraciones silenciosas debido a su menor consumo de energía y carga térmica estimadas. El ruido real depende del disipador específico.
10¿Cuál es mejor sin reemplazar la fuente de alimentación?+
Arc A750 es la opción más segura porque su consumo de energía declarado es menor. Verifique la potencia, la antigüedad y los conectores de la fuente de alimentación.
11¿Merece la pena actualizar desde la generación anterior?+
Considera actualizar a RX 7900 GRE si tu dispositivo actual ya no ofrece los FPS, la capacidad de memoria o las funciones necesarias. Una mejora inferior al 15-20% suele justificar la espera de una rebaja de precio.